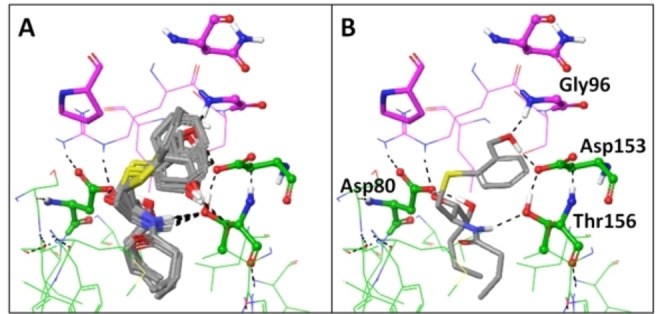
Figure 10.

Docking results for MCS‐0208 (13) with PDB: 3RTQ crystal structure, A) Superposition of 10 poses obtained after iterative docking jobs B) representative image of the best pose. CD1d carbons are coloured in green while TCR α‐chain carbons are coloured in pink. H‐Bond interactions are coloured in black dashed lines.
