
FIGURE 1.
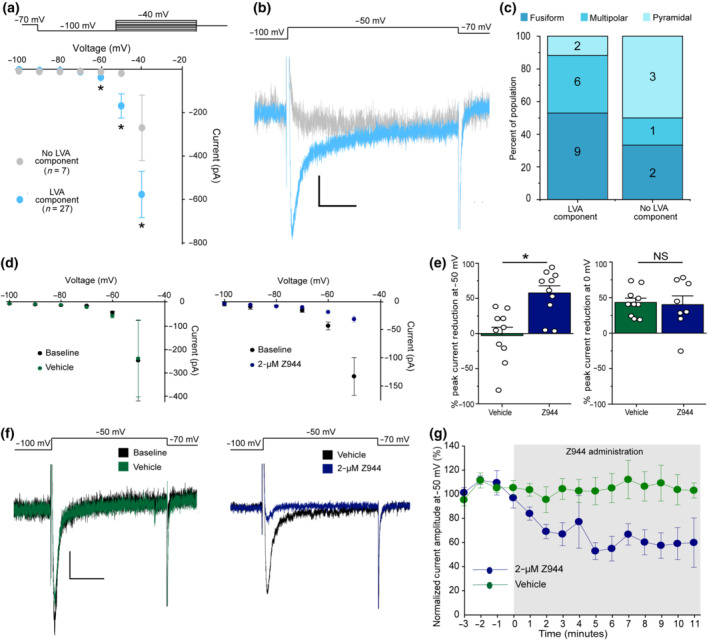
Z944 selectively reduces inward current through low voltage‐activated calcium channels in spinal cord lamina I neurons. (a) Top: Voltage‐clamp protocol used to measure calcium currents in lamina I neurons. Neurons were hyperpolarized to −100 mV for 500 ms, before a 500‐ms step current injection beginning at −100 mV and increasing by 10 pA each sweep. Bottom: Analysis of calcium currents revealed two populations of lamina I neurons; those with a low voltage‐activated (LVA) component (27/34, light blue), and those lacking an LVA component (7/34, light grey circles). Peak current with steps to −60, −50 and −40 mV was compared between neurons with and without an LVA component using unpaired Mann–Whitney t‐tests (−60 mV: P <.05, −50 mV: P <.05 −40 mV: P = .05). (b) Current traces in example neurons with an LVA component (light blue) and without an LVA component (light grey) for a voltage step from −100 mV to −50 mV. Scale bar y axis = 20 pA, x axis = 100 ms. (c) Distribution of morphologies in a subset of recorded neurons. Where possible, neurons were classified into three main morphologies. (d) In a subset of neurons with an LVA component, IV‐curves were plotted for baseline recordings and after vehicle (n = 8 neurons, left, green) or Z944 (n = 10 neurons, 2 μM, right, blue) administration. (e) Left: Quantification of percent peak current reduction at −50 mV for vehicle (green) and Z944 (blue) administration (Student's unpaired t‐test, P < .05, n = 10 neurons for both conditions). Right: Quantification of percent peak current reduction at 0 mV for vehicle (green) and Z944 (blue) administration (Student's unpaired t‐test, n = 10 neurons for vehicle and 8 neurons for Z944). (f) Sample current traces induced by depolarization from −100 mV to −50 mV. Left: Before (black) and after vehicle (green) administration. Right: Before (black) and after Z944 administration. Scale bar y axis = 20 pA, x axis = 150 ms. (g) Time course of peak current at −50 mV, normalized to first 3 min before administration of either vehicle (green, n = 6 neurons), or Z944 (blue, n = 6 neurons). All error bars represent ±SEM. *P < .05