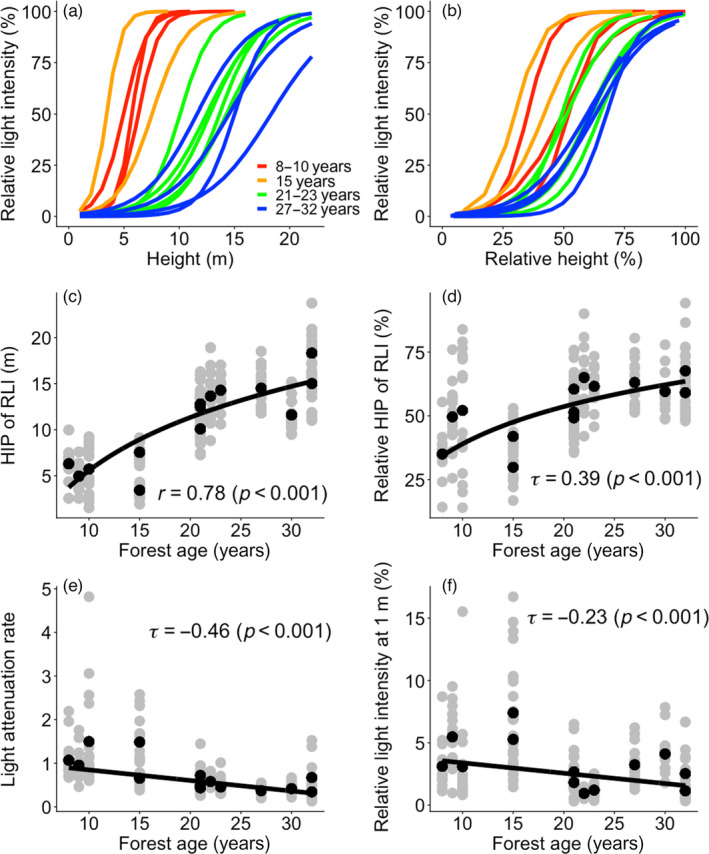
FIGURE 2.

Mean vertical light profile based on sigmoidal fitted curves against (a) the absolute height (m) and (b) the relative height compared to the maximum canopy height per plot (%). Light profiles are shown for 14 plots that differ in forest age since field abandonment (as indicated by different colours). (c) Absolute and (d) relative height of inflection point (HIP) of relative light intensity (RLI), (e) light attenuation rate and (f) RLI at 1 m versus forest age. Grey dots represent the value of each of the 16 subplots, and black dots represent the average value across the 16 subplots per plot. The results of the regression line (black line) and coefficient of determination (r: Pearson correlation coefficient and τ: Kendall's Tau) are shown. Pearson correlation coefficient was obtained using linear mixed model setting plots as a random factor. Kendall's Tau was obtained using the nonparametric Mann–Kendall trend procedure, and the slope and intercept of its regression line were obtained using Sen's protocol. Light attenuation rate is the slope of light extinction at the inflection point, and HIP is the height of 50% RLI based on sigmoidal fitted curves per plot. Regression lines are (c) y = 8.31 log(x) − 13.56; (d) y = 21.11 log(x) − 9.62; (e) y = −0.024x + 1.09; (f) y = −0.083x + 4.22
