
Figure 3.
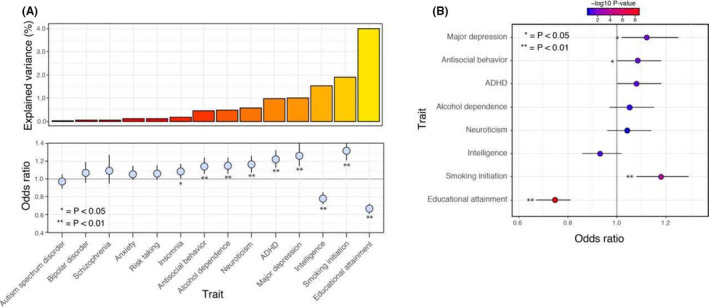
(A) The explained variance for all tested traits in the univariate analyses. The explained variance is based on Nagelkerke R 2. The effect sizes are shown as Odds Ratios (ORs). (B) The ORs based on the multivariable analyses
Official websites use .gov
A
.gov website belongs to an official
government organization in the United States.
Secure .gov websites use HTTPS
A lock (
) or https:// means you've safely
connected to the .gov website. Share sensitive
information only on official, secure websites.
(A) The explained variance for all tested traits in the univariate analyses. The explained variance is based on Nagelkerke R 2. The effect sizes are shown as Odds Ratios (ORs). (B) The ORs based on the multivariable analyses