
Fig. 2.
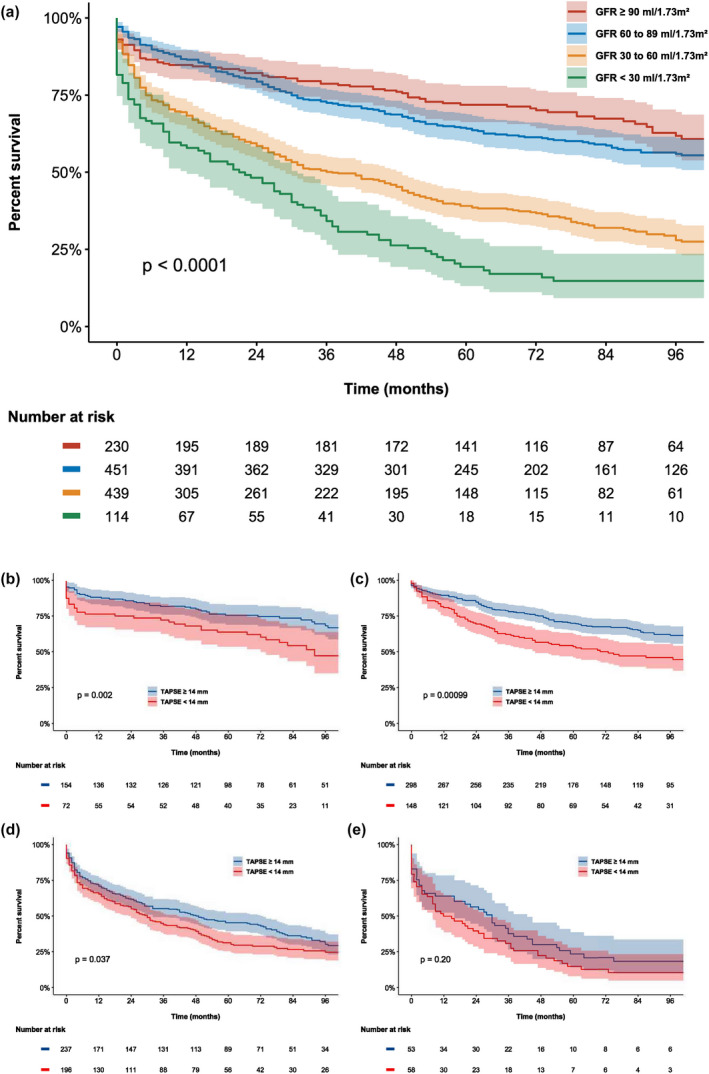
Kaplan–Meier estimates for all‐cause mortality stratified by renal function group and according to the presence of severe RV dysfunction (TAPSE < 14 mm). The Kaplan–Meier curves demonstrate reduced survival with worsening renal function (panel A) and the improved survival rates of patients with TAPSE ≥ 14 mm (blue line) compared to those with TAPSE <14 mm (red line) in renal function stage 1 (panel b), 2 (panel c) and 3 (panel d) CKD. For patients with severe renal impairment (stage 4 and 5 CKD, eGFR <30 mL min−1 1.73 m−2), the presence of severe RV dysfunction did not portend a worse prognosis (panel e). CKD, chronic kidney disease; GFR, glomerular filtration rate; TAPSE, tricuspid annular plane systolic excursion.