
Figure 1.
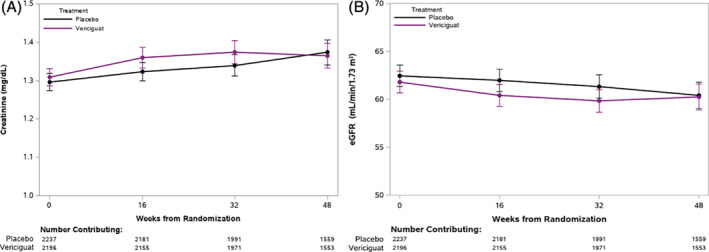
Change in serum creatinine (A) and estimated glomerular filtration rate (eGFR, B) over time in vericiguat‐ and placebo‐treated patients was assessed with a linear mixed model. This figure shows no differences in the change in creatinine (P = 0.18) and eGFR (P = 0.50) between the vericiguat and placebo groups, as evaluated by the interaction between treatment and study visit in the model.