
Figure 2.
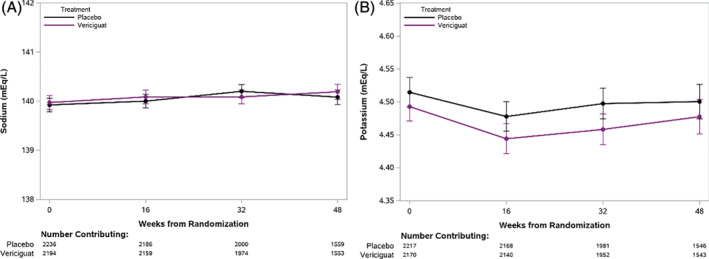
Trajectories of serum sodium (A) and potassium (B) over time in vericiguat‐ and placebo‐treated patients. Differences in trajectory between vericiguat and placebo groups were evaluated with a linear mixed model. This figure shows a small but significant change in sodium (P = 0.045) but no difference in change for potassium (P = 0.68) between vericiguat and placebo groups, as assessed via the interaction between treatment and study visit.