
FIGURE 1.
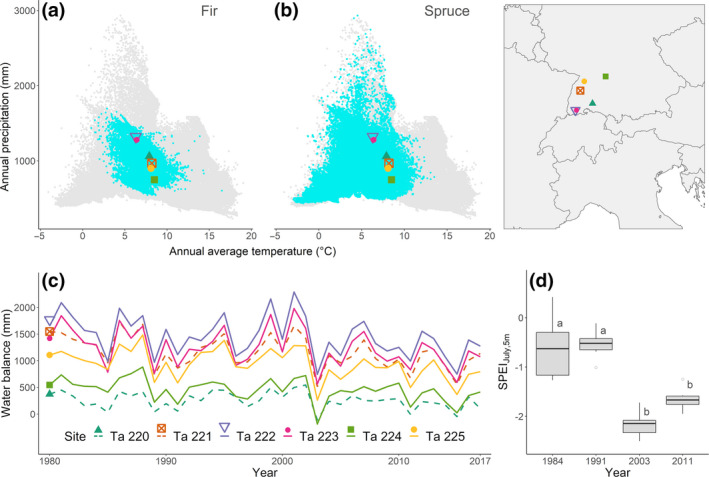
Location of study sites in central Europe, with climate‐space diagrams for (a) fir and (b) spruce; gray dots are all forest field observations in Europe, cyan dots are observed presence of the species in Europe and different symbols denote the six study sites. Presence data and temperature and precipitation data used in the climate‐space diagrams were extracted from the European Atlas of Forest Tree Species (San‐Miguel‐Ayanz et al., 2016), and from WorldClim 2 (Fick & Hijmans, 2017) for the study sites. (c) Annual climatic water balance (annual sum of precipitation – annual potential evapotranspiration) for the period 1980–2016 across study sites. (d) Box plots of the Standardized Precipitation and Evapotranspiration Index of July at the time scale of 5 months (SPEIJuly,5m) for the four drought events analyzed. Different letters indicate significant differences among years (ANOVA test, α < 0.05)