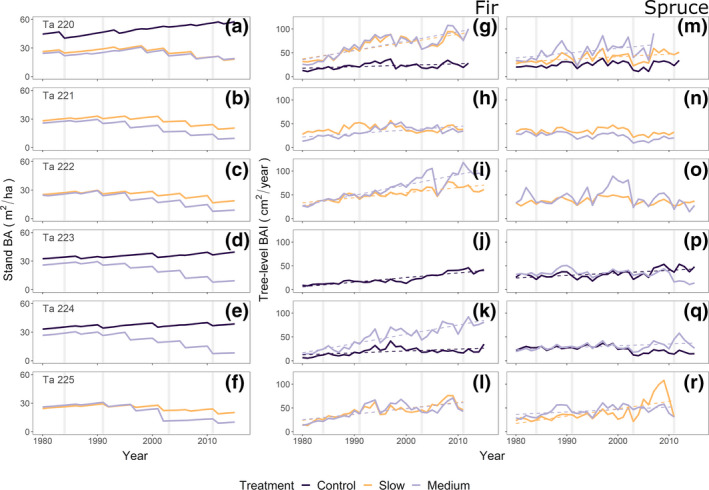
FIGURE 2.

Stand basal area (BA, m2/ha, panels a–f) and mean annual tree‐level basal area increment (BAI, cm2/year) of fir (panels g–l) and spruce (panels m–r) across the analyzed treatments and sites (Ta 220–225) since 1980 (see Figure S9 for tree‐ring width indices). Linear regression lines (dotted) in panels (g–r) show significant growth trends. Vertical gray lines denote the years 1984, 1991, 2003 and 2011
