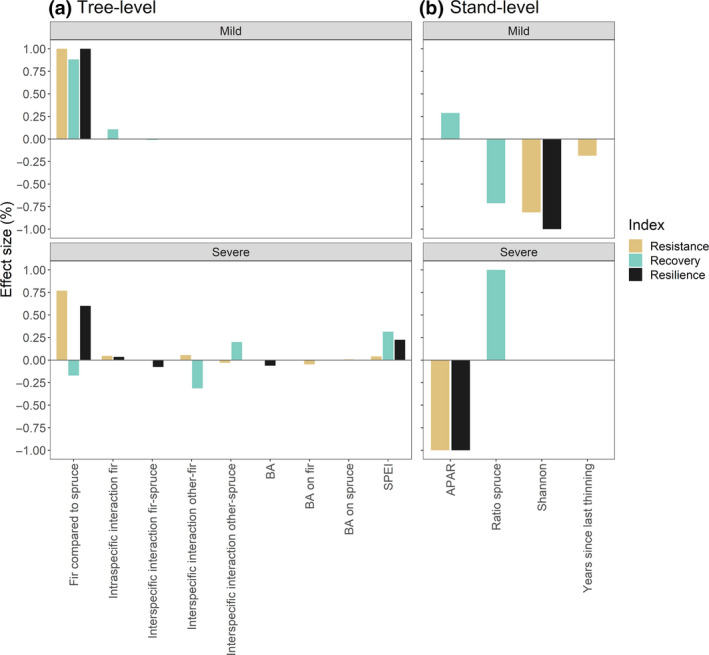
FIGURE 3.

Variance components showing the proportion of total variation in (a) tree‐level and (b) stand‐level resistance, recovery and resilience to mild and severe drought events explained by each predictor variable (effect size). Fir compared to spruce = species comparison: response (resistance, recovery and resilience) of fir compared to spruce; BA = effect of residual stand basal area on both fir and spruce; BA on fir/spruce = effect of residual stand basal area on fir/spruce; Intraspecific interaction fir = effect of intraspecific interaction on fir; Interspecific interaction fir‐spruce = effect of interspecific interaction of fir with spruce; Interspecific interaction other‐fir/spruce = effect of interspecific interaction of other species (mainly beech) with fir/spruce; SPEI = effect of SPEI of July at the time scale of 5 months; APAR = effect of absorption of photosynthetically active radiation; Ratio spruce = effect of ratio of basal area of spruce to total stand basal area; Shannon = effect of Shannon diversity index; Years since last thinning = effect of the number of years since the last thinning
