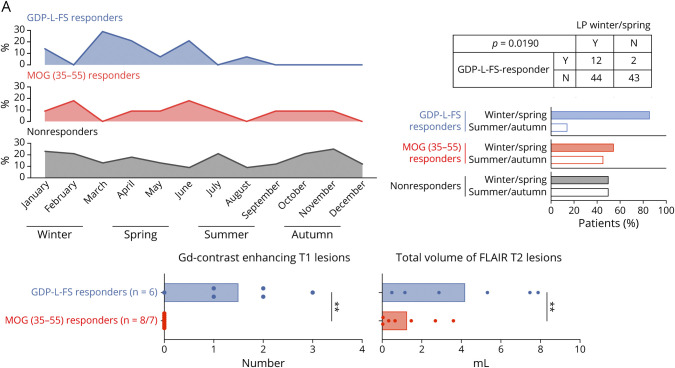
Figure 6. Characterization of GDP-L-FS and MOG(35-55) Responder Patients.
(A) Monthly distribution of LPs and frequency of samples obtained in winter/spring and summer/autumn in GDP-L-FS, MOG(35-55), and nonresponders. Red shadows show months with higher differences. Number of patients responding or not to GDP-L-FS in which LP was obtained in winter/spring (Y, yes) or not (N, not) and p values for Fisher exact tests are shown. (B) Number of total contrast-enhancing T1 lesions and total volume of flair T2 lesions (expressed in mL) in GDP-L-FS- and MOG(35-55) responders. Each dot in the graphs corresponds to a single patient, and the bars show the mean. We used t test for normally distributed variables to compare two groups of patients. Statistical significance (**p < 0.01) is shown. GDP-L-FS = GDP-l-fucose synthase.

