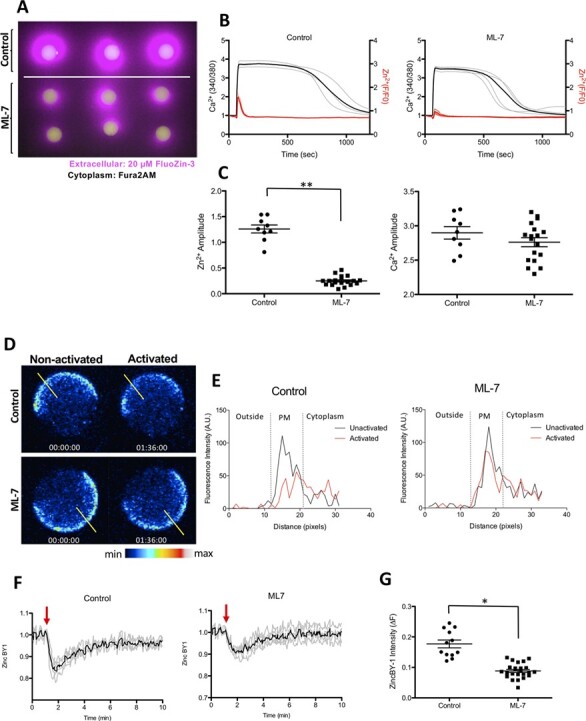
Figure 2.

ML-7 treatment blunts the zinc spark in ionomycin-activated mouse eggs and reduces zinc localisation to the cortex. (A) The moment of the zinc spark (detected by 20 μM Fluozin-3) in control and ML-7-treated mouse MII eggs in response to activation by 2.5 μM ionomycin. (B) Zinc and calcium profiles in control and ML-7-treated mouse eggs. Representative time traces of normalised zinc fluorescence (red, F/F0) and calcium fluorescence (black. 340/380) are shown for control and ML-7-treated mouse MII eggs. (C) The amplitudes of the zinc spark and calcium rise in control and ML-7 treated eggs. (D) A representative of the time course montage of the intensity of intracellular labile zinc located in the cortex of 5 μM ionomycin-activated control and ML-7-treated mouse eggs. The LUT colour scale is displayed at the bottom. (E) Histograms of the fluorescence intensity zincBY1 in eggs across their PMs. Yellow lines were drawn through the eggs, and pixel intensities were quantified, with outside the cell, PM and cytoplasm regions noted. (F) Representative ZincBY-1 intensity profiles of ionomycin-induced control and ML-7 treated eggs. (G) A dot graph quantifying the change in ZincBY-1 intensity (ΔF) across activation; ML-7 treated eggs exhibited 51% less reduction in their ZincBY1 staining after activation compared with control eggs. Red arrows signify the addition of ionomycin. Data were presented as the mean (mean ± standard error or the mean) of at least three independent experiments. (* P < 0.05, ** P < 0.01).
