Figure 3.

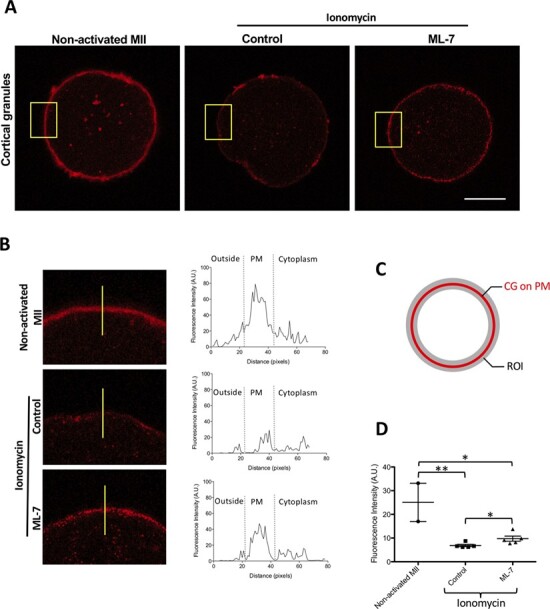
CG staining decreases in the cortex after activation of human eggs with ionomycin. (A) The cellular distribution of CGs (LCA) in a non-activated egg, an ionomycin-activated control egg and a ML-7-treated and ionomycin-activated egg. Scale bar, 50 μm. (B) A zoomed area of the PM and surrounding areas (yellow square) and fluorescence intensity on a line crossing the cell from outside the cytoplasm (represented yellow line, left panel). The distribution of CGs was examined in non-activated and control and ML-7-treated activated MII eggs. Intensity profiles of LCA staining perpendicularly across the PM and into the cytosol of eggs (right panel in (B). (C) The ROI to measurement of total intensity of CGs in PM. (D) The fluorescence intensity of CGs was measured in non-activated, activated control and activated ML-7 eggs. Data were presented as the median. (* P < 0.05, ** P < 0.001).
