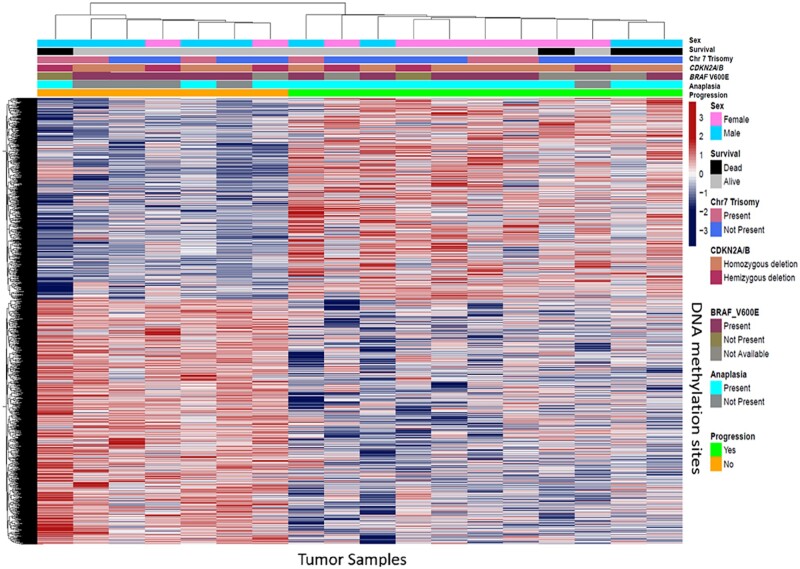
FIGURE 3.
Heat map of DNA methylated regions of PXA samples using the top 10 000 most differentially methylated probes. Hierarchical supervised clustering was based on disease presence or absence of progression, anaplasia, BRAF V600E mutation, CDKN2A/B homozygous deletion, and Trisomy 7. Methylation beta-values are illustrated according to the color scale.

