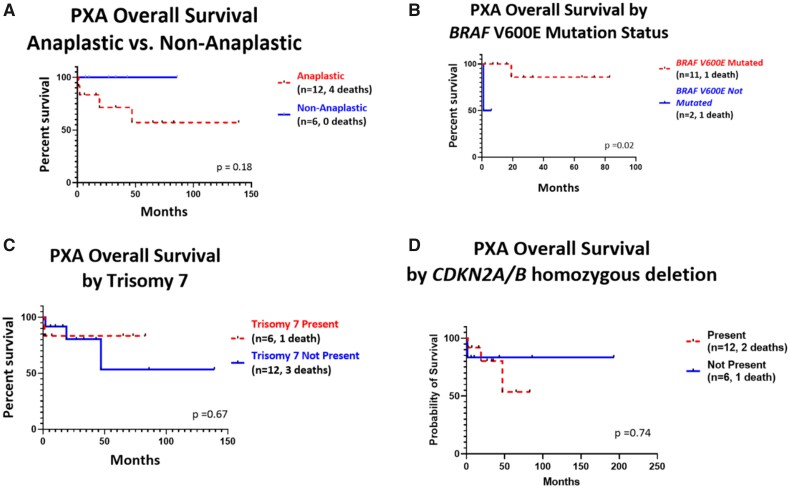
FIGURE 4.
Kaplan-Meier curves showing overall survival of PXAs in our cohort. (A) Overall survival curve based on presence or absence of anaplasia. In our cohort, the absence of anaplasia was not statistically significantly associated with overall survival (p = 0.18). (B) Overall survival curve based on BRAF V600E mutation. Decreased overall survival was observed for subjects with tumors lacking the BRAF V600E mutation (p = 0.02). (C) Overall survival curve based on presence or absence of Trisomy 7. Trisomy 7 was not shown to be associated with overall survival (p = 0.67). (D) Overall survival based on CDKN2A/B deletion. CDKN2A/B homozygous deletion was not shown to be associated with overall survival (p = 0.74) compared with hemizygous deletion.

