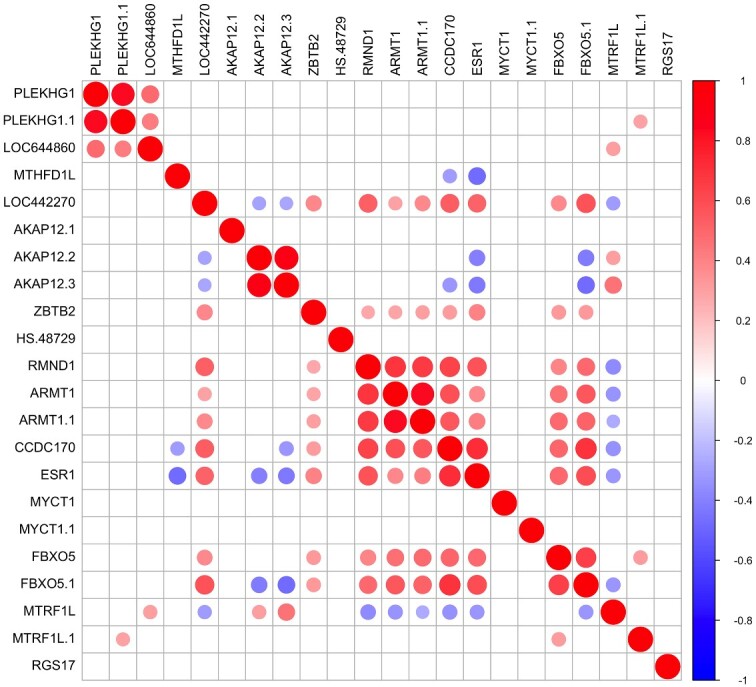
Figure 3.

Correlation matrix plot showing the correlation coefficients for the level of expression of pairs of genes as they appear on chromosome 6q25.1–6q25.2 within the ESR1 region. Gene expression was measured in endometrial samples from women collected across the menstrual cycle. Red color denotes genes showing positive correlations and blue denotes genes showing negative correlations.
