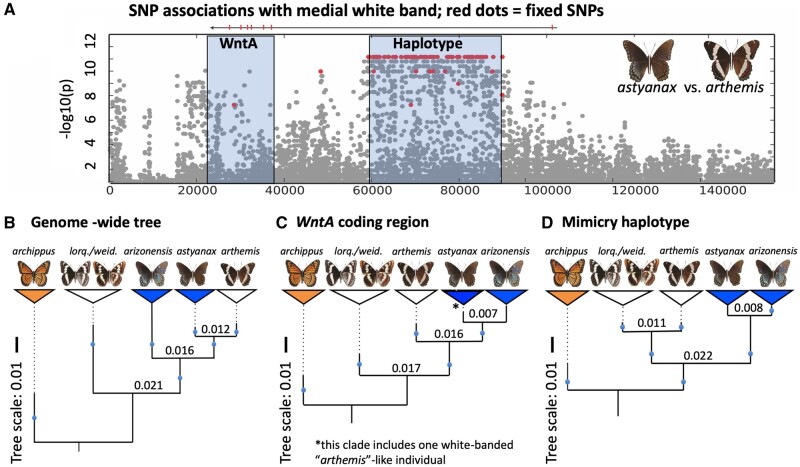
Fig. 3.
Comparison of genealogical patterns among sampled Limenitis species. (Panel A) Physical map of the WntA scaffold displaying the relative position of the WntA protein coding gene and casual haplotype. Grey dots represent polymorphic SNPs between Limenitis arthemis arthemis and Limenitis arthemis astyanax. Red dots are fixed SNPs between these two taxa. (Panel B–D) Maximum-likelihood trees with branch lengths extended (dashed lines) to align the terminal taxon labels. (Panel B) Species tree estimated from genome-wide SNPs with branch lengths (see also supplementary fig. S1, Supplementary Material online). (Panel C) Gene tree for the WntA protein coding region; *note that in panel C one nonmimetic individual (L. a. arthemis) grouped with all mimetic individuals of L. a. astyanax (see also supplementary fig. S4, Supplementary Material online). (Panel D) Gene tree for the associated haplotype showing monophyly of all mimetic samples (L. a. astyanax + Limenitis arthemis arizonensis). Blue circles indicate branches with >95% bootstrap support for all tree figures; trees were simplified by collapsing individuals into monophyletic groups represented by colored triangles. Numbers above internal nodes in Panels B–D represent absolute divergence (dXY) between taxa.

