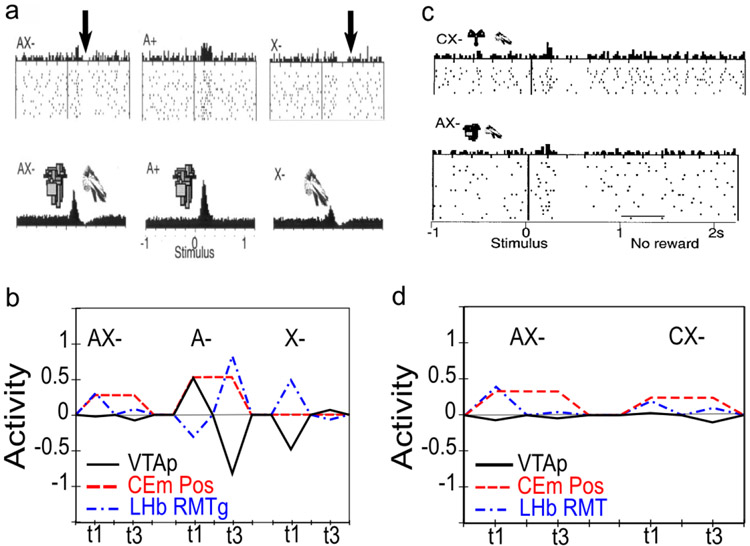
Figure 14:
Simulation 3b: Conditioned inhibition — learning to predict the omission of reward. (a) Empirical results from Tobler et al. (2003), adapted from Figure 3a,c, with permission from Society for Neuroscience: Journal of Neuroscience, copyright 2003, showing the pattern of phasic dopamine signaling seen after conditioned inhibition training, for the initially-conditioned CS (A+), the conditioned inhibitor (X−), and their pairing (AX−) (top panels = single cell histograms; bottom = population histograms). Note that the small early activation phase seen for X− in the population histogram was attributed to associative pairing with the A CS since it was eliminated by A- extinction training (while the depression component persisted). (b) simulation results showing qualitatively similar results produced by the PVLV model. For AX− there are both positive (CeMPos; dashed red line) and negative (LHbRMTg; speckled blue line) components driving dopamine signaling (VTAp; solid black line), but the model does not have the temporal resolution to see these separately as in the empirical data. (c) empirical results from Tobler et al. (2003), adapted from Figure 6a,b, with permission from Society for Neuroscience: Journal of Neuroscience, copyright 2003, showing the results of a summation test is which the conditioned inhibitor (X−) is compounded with a different separately-conditioned CS (C+) (top panel = CX− test, bottom = AX− test.) (d) simulation results for the summation test showing qualitatively similar results.

