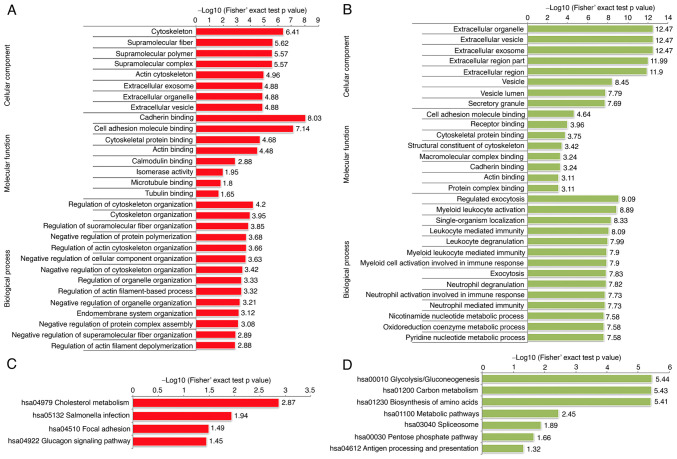
Figure 6.
Functional enrichment analysis of the proteins with upregulated and downregulated phosphosites in the RCC samples. GO-based enrichment analysis of proteins with upregulated (A) and downregulated (B) phosphosites. KEGG pathway-based enrichment analysis of proteins with upregulated (C) and downregulated (D) phosphosites. GO, Gene Ontology; KEGG, Kyoto Encyclopedia of Genes and Genomes.

