
FIGURE 1.
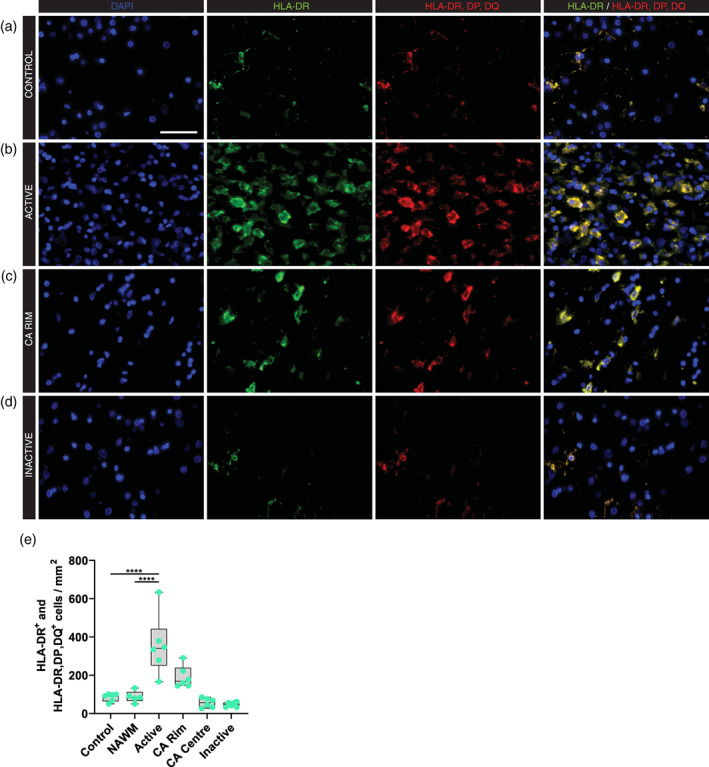
Expression of HLA‐DR/DP/DQ in white matter lesions in MS. Representative images of HLA‐DR/DP/DQ expression in control (a) and multiple sclerosis lesions (b–d); Active (b), chronic active (CA) rim (c) and inactive (d) lesions. (e) Quantitative analysis of the number of HLA‐DR and HLA‐DR/DP/DQ positive cells showed an increase in active lesions compared to control and NAWM tissues. (f) HLA‐DR positive cells and HLA‐DP/DQ/DR positive cells from single immunostainings show an overlap in the number of positive stained cells. ****p < .0001. Scale bar = 50 μm. NAWM = normal appearing white matter, CA = chronic active