FIGURE 4.

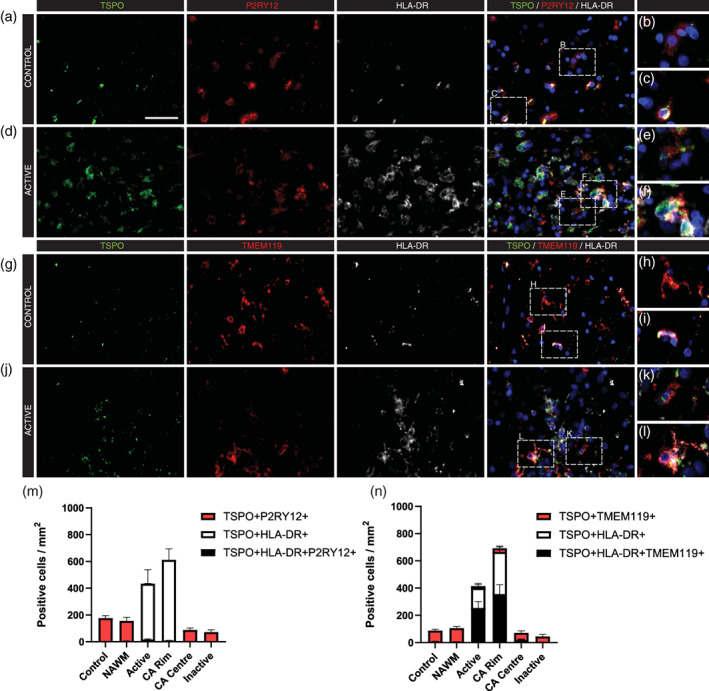
Microglia show a phenotypic shift in active lesions. Representative images of TSPO, P2ry12, and HLA‐DR (a–f) in control white matter (a–c) and an active MS white matter lesion (d–f) showing both TSPO + P2ry12 + HLA‐DR− cells (b,e) as well as TSPO + P2ry12 + HLA‐DR+ cells (c,f). Representative images of TSPO, TMEM119 and HLA‐DR (g–l) in control white matter (g–i) and an active white matter lesion (j–l) showing both TSPO + TMEM119 + HLA‐DR− cells (h,k) as well as TSPO + TMEM119 + HLA‐DR+ cells (i,l). Quantitative analysis showed a phenotypic shift and subsequent loss of P2ry12 expression in active lesion areas (m), as well as an increase in the cell density of microglia but a reduction in the percentage of TMEM119+ microglia/macrophages (n). Scale bar = 50 μm. Scale bar = 50 μm. CA, chronic active; NAWM, normal appearing white matter
