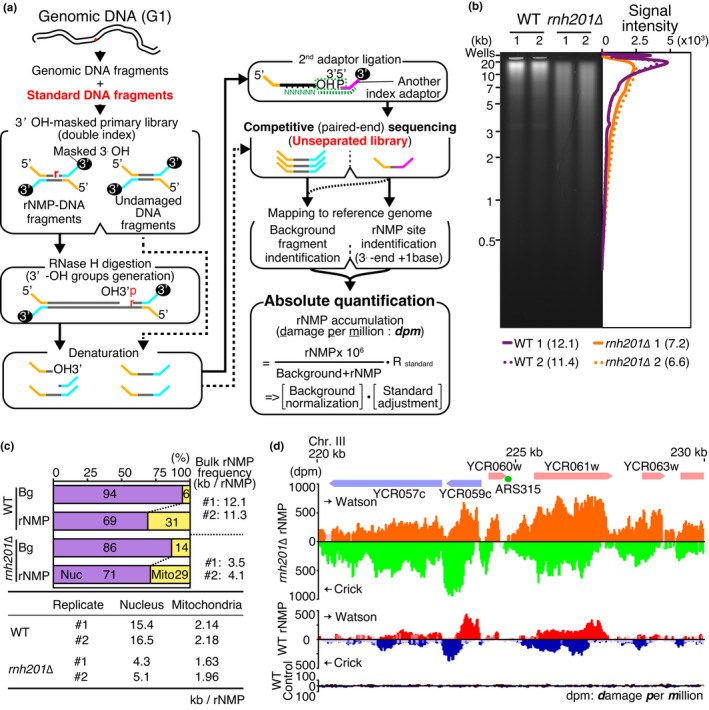
FIGURE 1.

RiSQ‐seq analysis of yeast genomic DNA. (a) Scheme of RiSQ‐seq. Strand‐specific primary libraries are prepared from sheared genomic DNA from G1‐arrested cells and synthetic standard DNAs by ligation with 3′‐OH masked adaptors. After 3′‐OH masking of libraries with ddNTP and terminal‐deoxynucleotidyl transferase, RNase H (HI and HII)‐treated primary libraries are heat‐denatured and ligated with secondary adaptors. Sequencing of unseparated libraries on a MiSeq instrument (Illumina) provides rNMP detection and background reads. Identification of fragments and rNMPs by mapping allows calculation of coverage for rNMP accumulation, adjusting based on a coefficient computed using spiked‐in standards, as damage per million bases (dpm). (b) Representative alkaline gel electrophoresis of genomic DNA from wild‐type (WT) and rnh201∆ strains (left), with accompanying lane profiles (right). Average DNA lengths are shown in parentheses (kb). (c) Bulk analysis of YPD‐cultured PCR‐free samples by RiSQ‐seq. Sequence composition of background (Bg) and rNMP (rNMP) in PCR‐free libraries is classified according to nuclear (Nuc) and mitochondrial (Mito) origin, with accompanying bulk rNMP frequency (upper panel). Bulk rNMP frequencies in nucleus and mitochondria of replicated samples are shown in the bottom table. Bulk rNMP frequencies of the replicate #1 and #2 are shown. (d) Nonuniform accumulation of rNMP, as determined by RiSQ‐seq analysis. Positions of chromosomes, genes, and the replication origin (ARS315) are shown (top panel). rNMP profiles of rnh201∆ (orange and green) and WT (orange and green) and control profile of WT sample without RNase H treatment (dark red and navy blue) are shown. rNMP profiles of Watson (upper) and Crick (lower) strands from YPD‐cultured replicate 1 are shown as bar plots with significance of change versus control, as determined by two‐sided Wilcoxon signed‐rank test (faint colored bars: p ≥.05). Note that the Crick strand's scale is increasing downward
