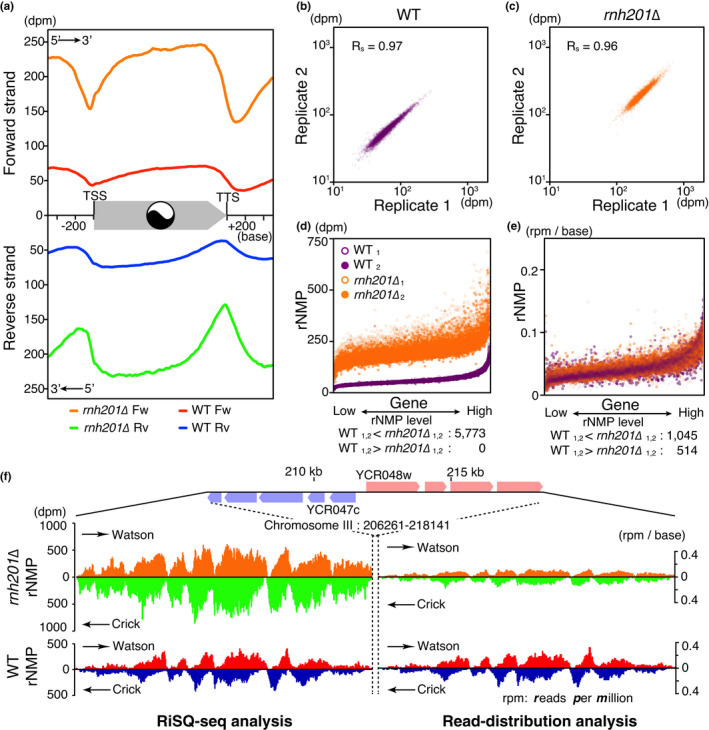
FIGURE 2.

Pattern and range sensitivity of RiSQ‐seq analysis. (a) Metagene profiles of rNMP accumulation on the forward (Fw) and reverse (Rv) strands. rNMPs accumulate in a “yin–yang” pattern at the center of the gene body. Metagene profiles were generated from mean values from YPD‐cultured replicated samples (gene, N = 5,828). Note that the reverse strand's scale increases downward. (b and c) Scatter plots to illustrate the reproducibility of RiSQ‐seq. Mean values of rNMP accumulation on the Watson and Crick strands of genes (N = 5,828) are plotted for YPD‐cultured replicated samples in the wild type (b) and rnh201∆ (c). Spearman's rank correlation coefficient rho is shown as Rs in each panel. (d and e) Comparison of rNMP ranges between the wild type and rnh201∆ by RiSQ‐seq (d) and read‐distribution analysis (e). Genes are sorted from low to high‐rNMP level, as determined by RiSQ‐seq analysis of wild‐type replicates. The number of genes with nonoverlapping rNMP ranges is indicated below (N = 5,773). (f) Composition of rNMP accumulation profiles in high‐rNMP cluster region, as determined by RiSQ‐seq and read‐distribution analysis. As in Figure 1d, rNMP profiles of Watson and Crick strands are shown at the same scale for the wild type and rnh201∆. For read‐distribution analysis, the rNMP value is shown as reads per million per base (rpm/base)
