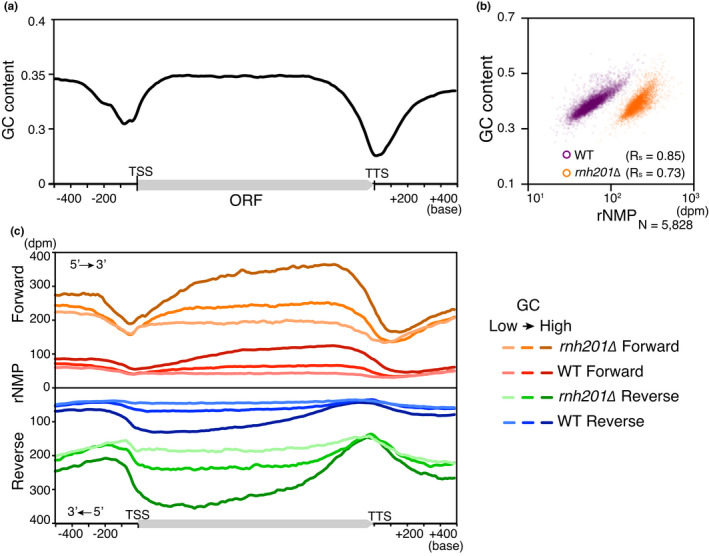
FIGURE 3.

rNMP accumulation associates with GC content. (a) Metagene profile of GC content is shown (gene, N = 3,489). (b) Scatter plots for GC content correlation of rNMP. As in Figure 2b and c, rNMP values from YPD‐cultured samples of rnh201∆ and the wild type are plotted at gene level, with accompanying correlation coefficient Rs. Nuclear rNMP data are shown. (c) Metagene profiles of rNMP accumulation are shown. The GC level of each gene is classified into quintiles, and metagene profiles of the lowest, middle, and highest fractions (gene, N = 1,163 each) are shown
