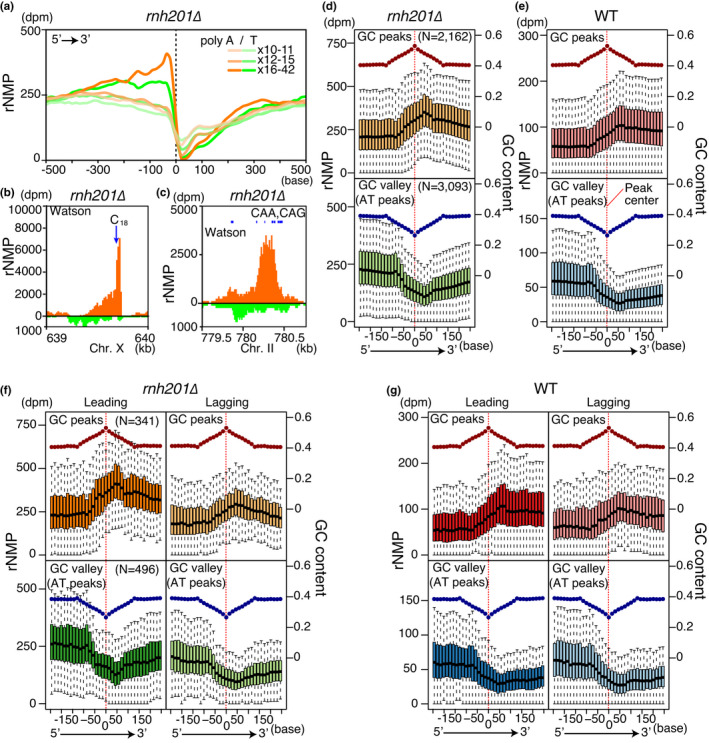
FIGURE 4.

3′‐shifted patterns of local rNMP accumulation. (a) Meta‐analysis around A/T homopolymers (>×10). Profiles of rNMP accumulation in rnh201∆ around homopolymers (N = 2,067) with the indicated length are plotted in the 5′→3′ direction. Dashed line and 0 indicate the centers of homopolymers. (B and C) rNMP profiles around a C stretch (b) and triplet repeats (c) as in Figure 1d. Characteristic repeats in Watson strands are shown. (d–g) Boxplots of rNMP accumulation in the wild type (e and g) and rnh201∆ (d and f) around GC and AT peaks, with mean GC contents (dots). rNMP distribution around isolated GC (upper panels) and AT peaks (lower panels) (252 bases 5′‐upstream and 3′‐downstream) is shown in 14‐base bins. Red dashed lines show center positions of GC and AT peaks. To show major distribution, upper and lower extremes show one quartile range, and outliers are not shown. In (f) and (g), peaks with high bias of Okazaki fragment coverage rate (OF‐bias >0.9) are selected
