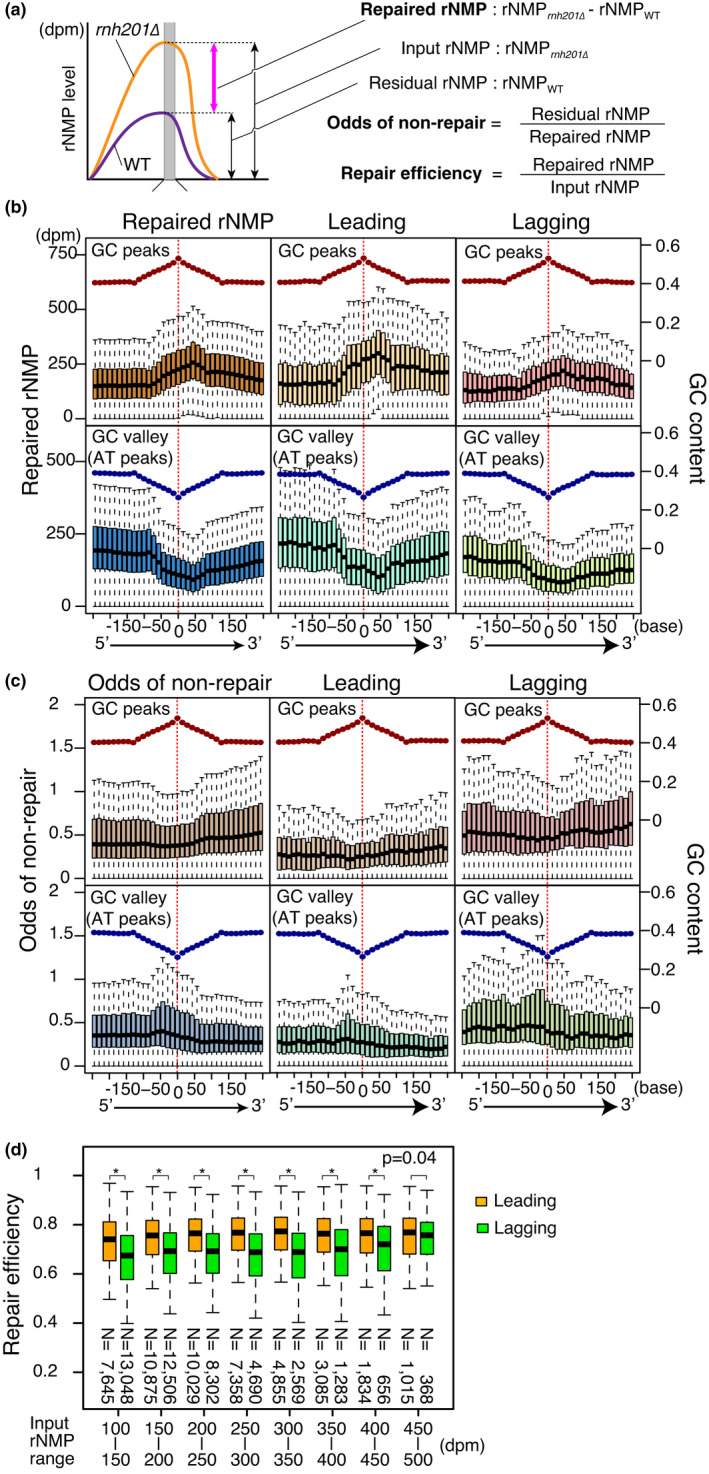
FIGURE 6.

Efficient RER activity on the leading strand. (a) Definition of repaired rNMP, odds of nonrepair, and repair efficiency. (b) Repair efficiencies of leading and lagging strands (N = 52,338) were analyzed by linear regression models without intercepts. (b and c) Boxplots of repaired rNMP (b) and odds of nonrepair (c) around GC and AT peaks as in Figure 4d. (d) Repair efficiency of leading and lagging strands at different levels of rNMP input. Repair efficiencies between leading and lagging strands were compared using the two‐sided Mann–Whitney U test. *p < 2.0 × 10⁻¹⁶
