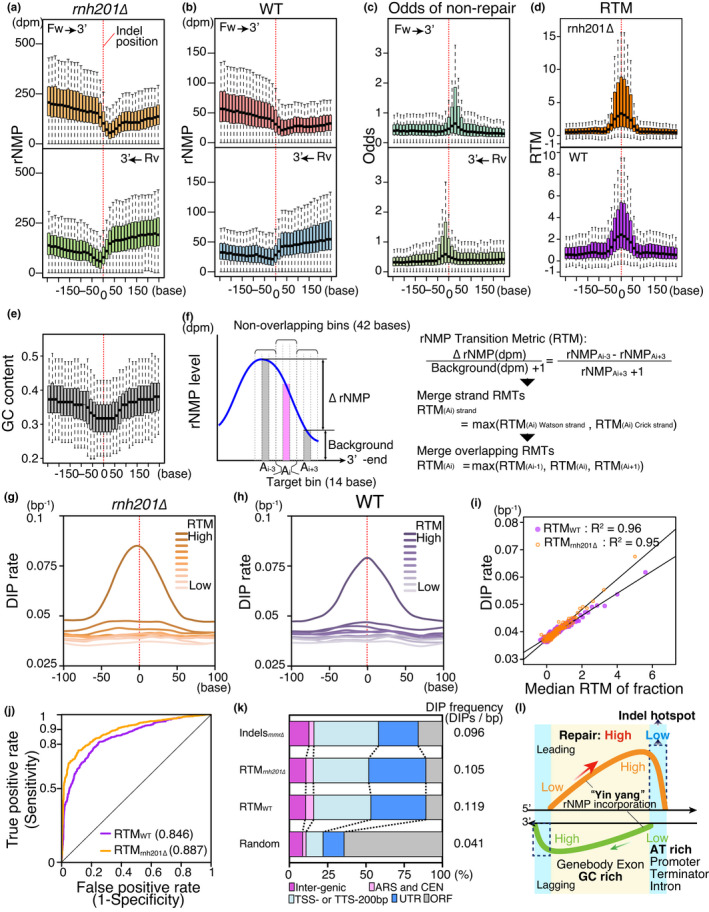
FIGURE 7.

rNMP transition sites are associated with indel mutation. (A and B) rNMP distribution in rnh201∆ (a) and the wild type (b) around 1,012 indels previously identified in the msh2∆ cells (Lujan et al., 2014). Red dashed lines indicate indel positions. Forward (upper panel) and reverse (lower panel) strands are classified by OF‐rate at each mutation site, that is, forward indicates the major replication direction. (c) Distribution of odds of nonrepair, as in (a). (d) Distribution of rNMP transition metric (RTM) in rnh201∆ (upper panel) and the wild type (lower panel). Distribution is shown in the forward strand direction. (E) GC content around indel mutations, as in (d). (f) Definition of rNMP transition metric (RTM). (g and h) Meta profiles of DIP rate around peak fractions. Peaks of rnh201∆ RTM (g) and wild‐type RTM (h) are fractionated into deciles, and DIP rate around each peak fraction is shown. Distribution on the Watson strand is shown. (i) Relationship of RTM to DIP rate is analyzed by regression analysis. Means of DIP rate in each percentile fraction are plotted. R2 of fit is indicated. (j) ROC curve of RTMs for identification of indel mutations. AUCs are also indicated. (k) Annotation composition of indel hotspots predicted by RTMs. Classified annotations of predicted indel hotspots are shown, with accompanying DIP frequency (rnh201∆: N = 2,339, WT: N = 1,519). Previously reported indels in mmr∆ (msh2∆) by Lujan et al. (N = 1,012) and randomly selected sites (N = 2,339) are also shown as controls. (l) The distinct preferences of incorporation and repair of rNMPs result in indel hotspots. The yin–yang pattern of rNMP incorporation in GC‐rich region spreads over adjacent AT‐rich regions with a preference for the leading strand. The regions of RER inefficiency associate with rNMP transition sites, AT‐rich regions, and indel hotspots
