
FIGURE 3.
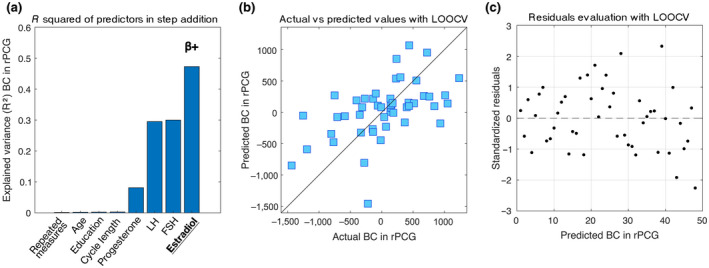
Multilinear model with leave‐one‐out cross‐validation (LOOCV). The model aims to predict the topological variation of the brain network expressed by the BC changes during the MC (Δ T2–T1 and Δ T3–T2) of the right posterior cingulate gyrus (rPCG). (a) Explained variance of the additive model composed of four nuisance variables (repeated measures, age, education, cycle length), and four predictors (progesterone, luteinizing hormone (LH), follicle‐stimulating hormone (FSH), estradiol). Significant predictor in underlined text; positive coefficient indicated with β+. (b) Scatter plot of the Observed topological values versus the topological values predicted by the model with LOOCV. (c) Scatter plot of the standardized residuals (standardization of the difference between observed and predicted (LOOCV) values). The distribution results symmetrical with respect to the 0, with a standard deviation lower than 2.5