
FIGURE 5.
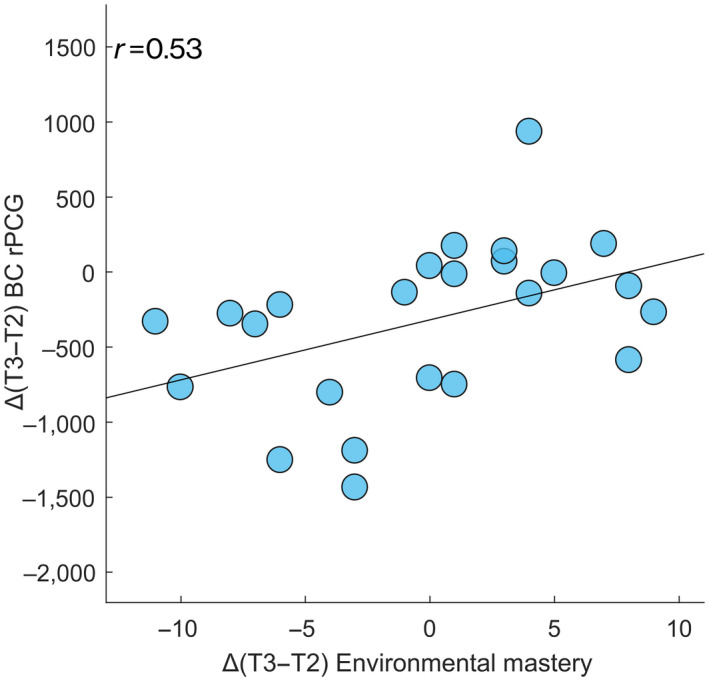
Correlation between topological data and psychological dimensions of well‐being test. Spearman's correlation between the Δ values (here expressed as the difference between the mid‐luteal (T3) and peri‐ovulatory (T2) phases of the MC) of the BC of the right posterior cingulate gyrus (rPCG) and the Δ values of the psychological dimension of well‐being test (Environmental mastery scores) along the MC (p = 0.007, p FDR = 0.043)