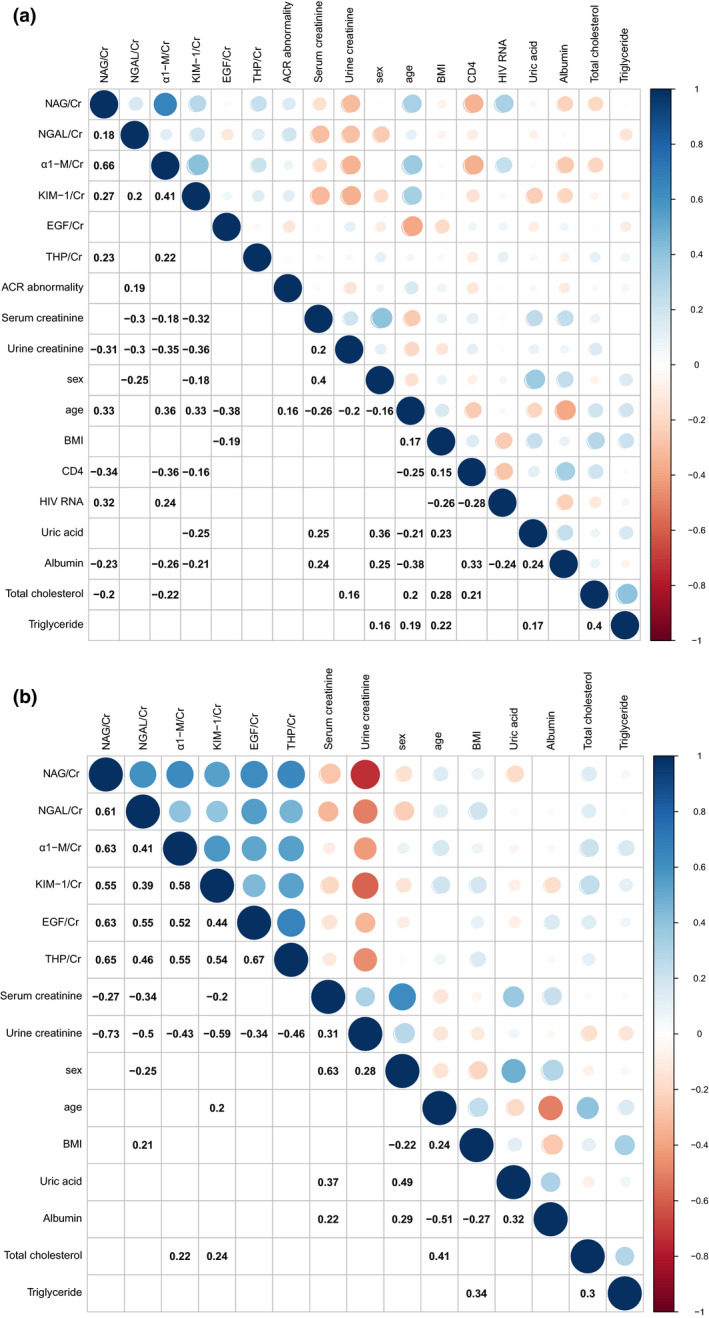
Fig. 2.

Spearman correlation between urinary biomarkers and clinical parameters in the HIV‐positive group (a) and the HIV‐negative group (b) before propensity score matching. The circle colour indicates the value of Spearman correlation coefficients. Blue indicates a positive correlation and red indicates a negative correlation. White grid without blue or red circle indicates no significant correlation (P > 0.05). Cr indicates urine creatinine; NAG, N‐acetyl‐β‐D‐glucosaminidase; NGAL, neutrophil gelatinase‐associated lipocalin; α1‐M, alpha 1‐microglobulin; KIM‐1, kidney injury molecule‐1; THP, Tamm–Horsfall protein; EGF, epidermal growth factor; BMI, body mass index.
