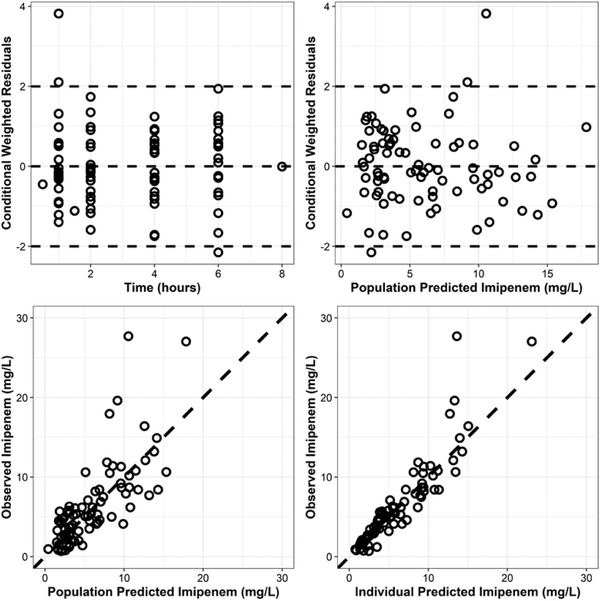
Figure 2.

Goodness‐of‐fit plots. Top, conditional weighted residuals (CWRES) versus time and population model‐predicted concentration (mg/L). Bottom, observed imipenem concentration (mg/L) versus population and individual‐predicted concentrations (mg/L).
