
Figure 3.
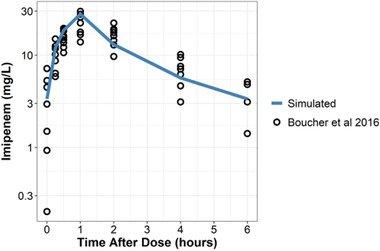
Visual comparison of mean simulations (blue line) with observed data (black circles) from Boucher et al (2016) after a 1‐hour infusion of 1000 mg imipenem every 6 hours at steady state. Mean demographics from Boucher et al used as covariates for the simulation were weight of 90 kg, total burn surface area of 23% (corresponding to albumin 3.2 g/dL), and CVVH CL of 3.27 L/h. Data from Boucher et al was recreated with WebPlotDigitzer 4.4 (https://apps.automeris.io/wpd/).