
Fig 5.
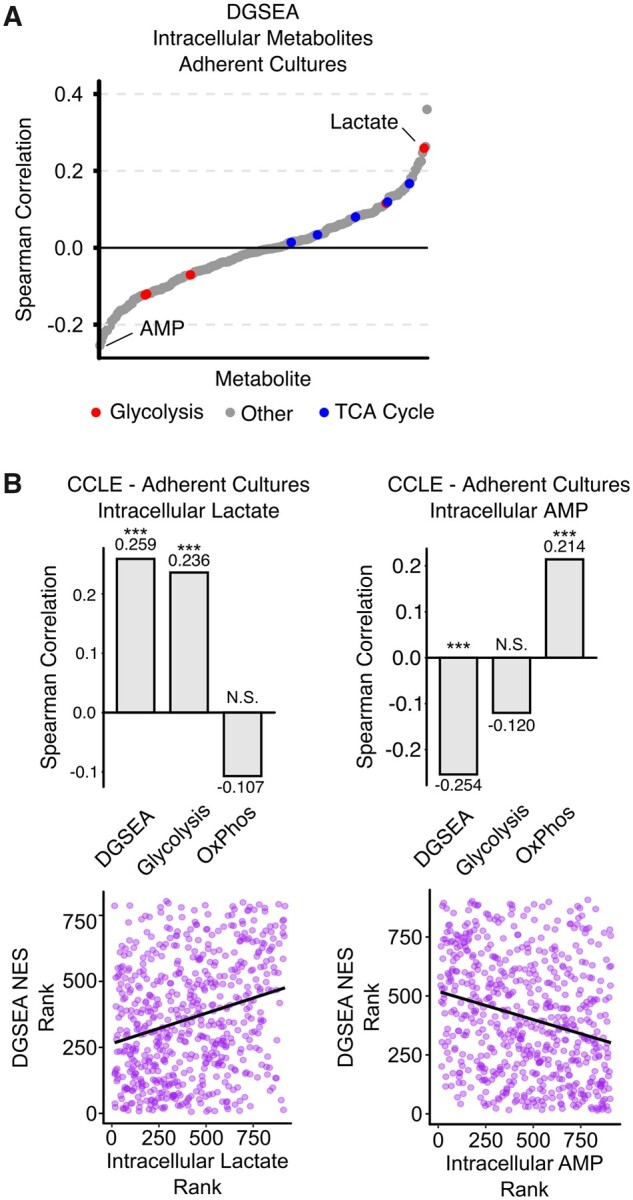
DGSEA is a better predictor of intracellular lactate and AMP levels than GSEA for adherent cell cultures. (A) Increased intracellular lactate and decreased AMP correlated with increased glycolysis and decreased OxPhos. RNASeq data were centered and scaled across all adherent cell culture lines in the Cancer Cell Line Encyclopedia and then the Spearman correlation coefficient was calculated between DGSEA NESs and metabolite abundances. Lactate was the second most correlated metabolite, and AMP was the least correlated metabolic with DGSEA. (B) Barplots showing the comparison of DGSEA and glycolysis and OxPhos GSEA. Scatter plots showing the correlation between DGSEA and lactate or AMP are shown. *** indicates P < 0.001