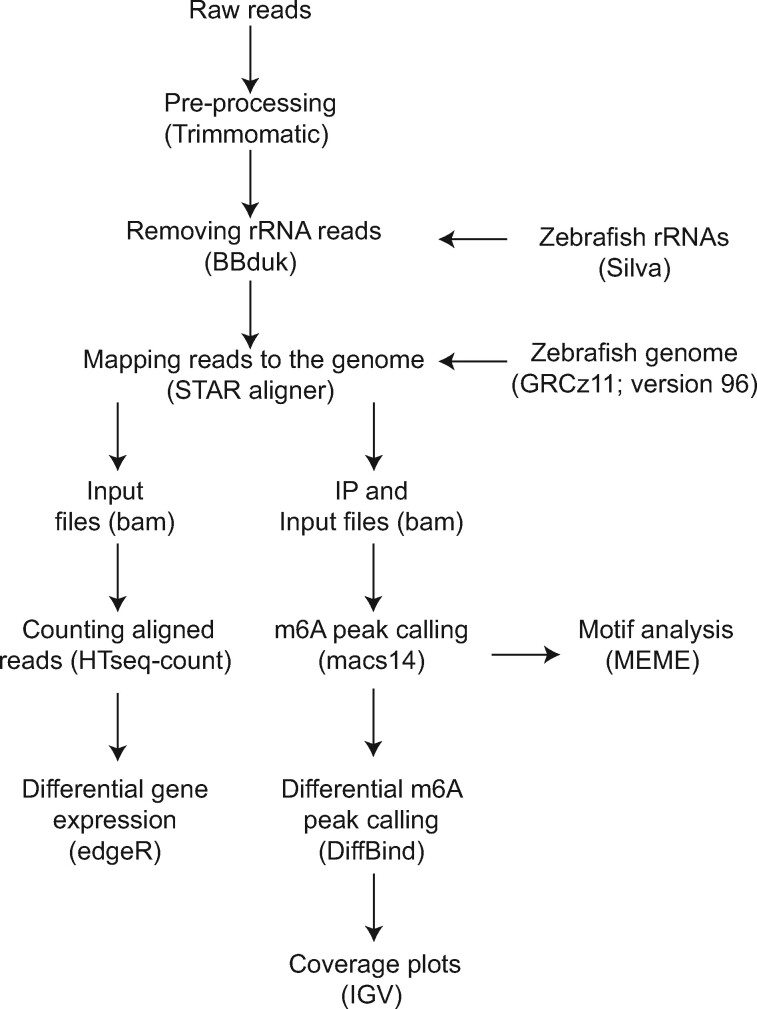
Figure 1.
Overview of the MeRIP analysis pipeline. Raw reads were trimmed and ribosomal RNA reads were filtered prior to mapping to the genome and m6A peak calling, followed by statistical analysis. Integrated Genome Viewer (IGV) was used to visualize the m6A peaks. Input reads were used for differential gene expression and exon usage analysis. The detailed description of the analysis is provided in the Materials and Methods section.

