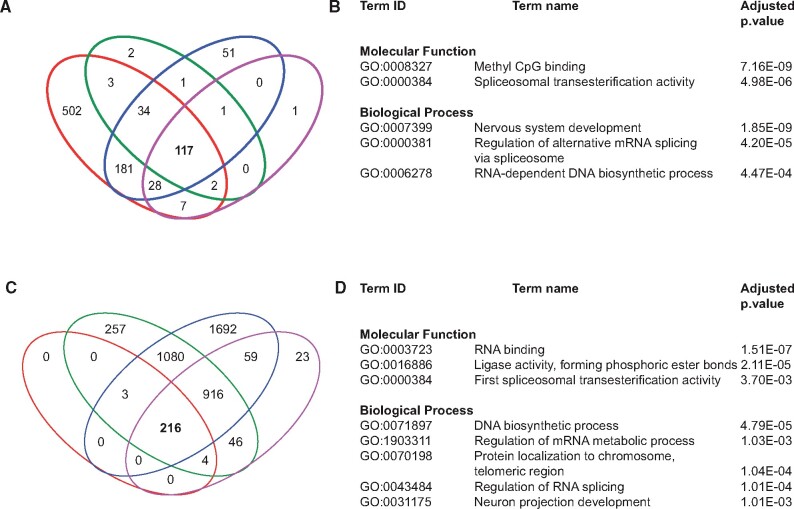
Figure 3.
m6A RNA modification patterns in DMSO and PCB126 samples. A and C, Venn diagram showing the unique and shared m6A peaks among biological replicates in DMSO and PCB126 groups. B and D, Gene Ontology analysis (Biological Process and Molecular Function) of m6A peaks common to all 4 biological replicates in DMSO and PCB126.

