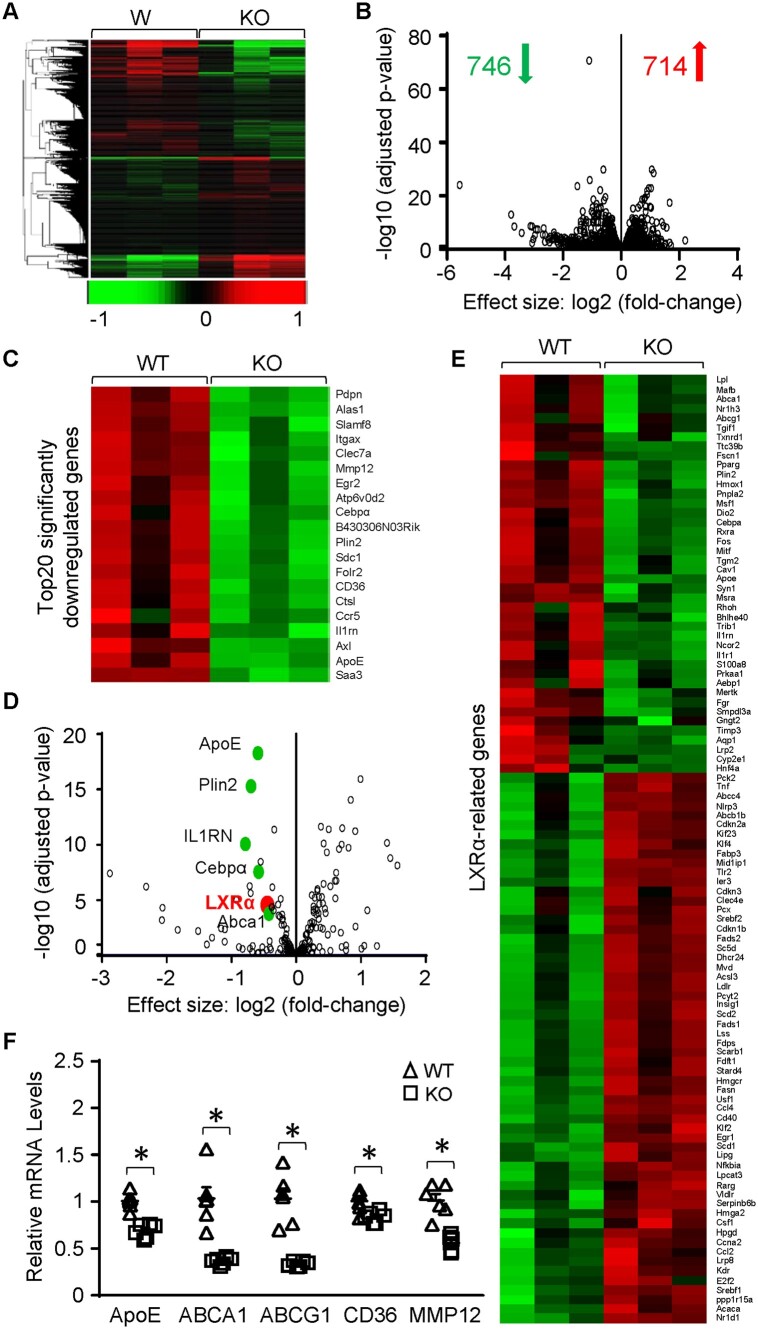
Figure 5.
Gene expression profile in Sectm1a KO BMDMs determined by high-throughput RNA-seq. (A and B) Heatmap (A) and volcano plot (B) of the overall gene expression alteration in BMDMs isolated from WT and Sectm1a KO mice (n = 3 per genotype). (C) Heatmap showing the top 20 most significantly down-regulated genes in Sectm1a KO BMDMs. (D and E) Volcano plot (D) and heat-map (E) of all LXR-related genes that were differentially expressed in Sectm1a KO BMDMs. (F) expression of most common LXR-target genes in Sect1ma KO BMDMs were validated using qRT-PCR. n = 3 for each genotype (*P < 0.05; data are presented as mean ± SEM; Student’s t-test).

