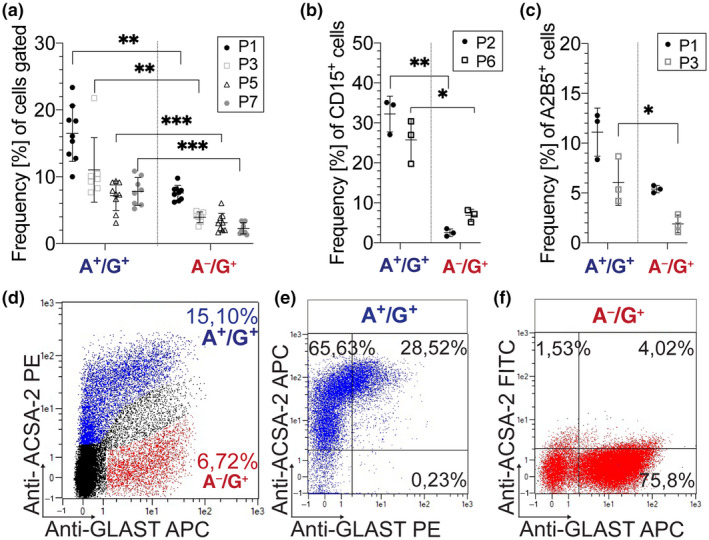
FIGURE 3.

Flow cytometry reveals a gliogenic marker expression on A+/G+ cells. (a–d) Cerebella (P1–P7) were dissociated, stained, and analyzed by flow cytometry. (d) Anti‐ACSA‐2 and Anti‐GLAST show a highly dynamic range of dim and broad expression. The marker analyses were based on the presence (A+/G+ as marked in blue in d) and absence of ACSA‐2 (A−/G+ as shown in red in d). (a) Frequencies of A+/G+ cells were significantly higher than A−/G+ cells ((P1): **p = 0.008; (P3): **p = 0.0057; (P5): ***p = 0.0007; (P7): ***p = 0.0005; paired t test; n = 7). At early neonatal age (P2/P3), the glial precursor markers CD15 (b) and A2B5 (c) were significantly higher expressed on A+/G+ cells compared to A−/G+ cells. The difference in CD15 expression was maintained at P6 (b: (P1): **p = 0.0054; (P6): *p = 0.0139; unpaired t test; n = 3) (c: (P3): *p = 0.032; unpaired t test; n = 3). (e,f) Magnetic isolation allowed for efficient enrichment of A+/G+ (86.34% ± 9.3% n = 3) (e) and A−/G+ cells (76.26% ± 2.179% n = 11) (f) from dissociated cerebellar tissue (P1–P3)
