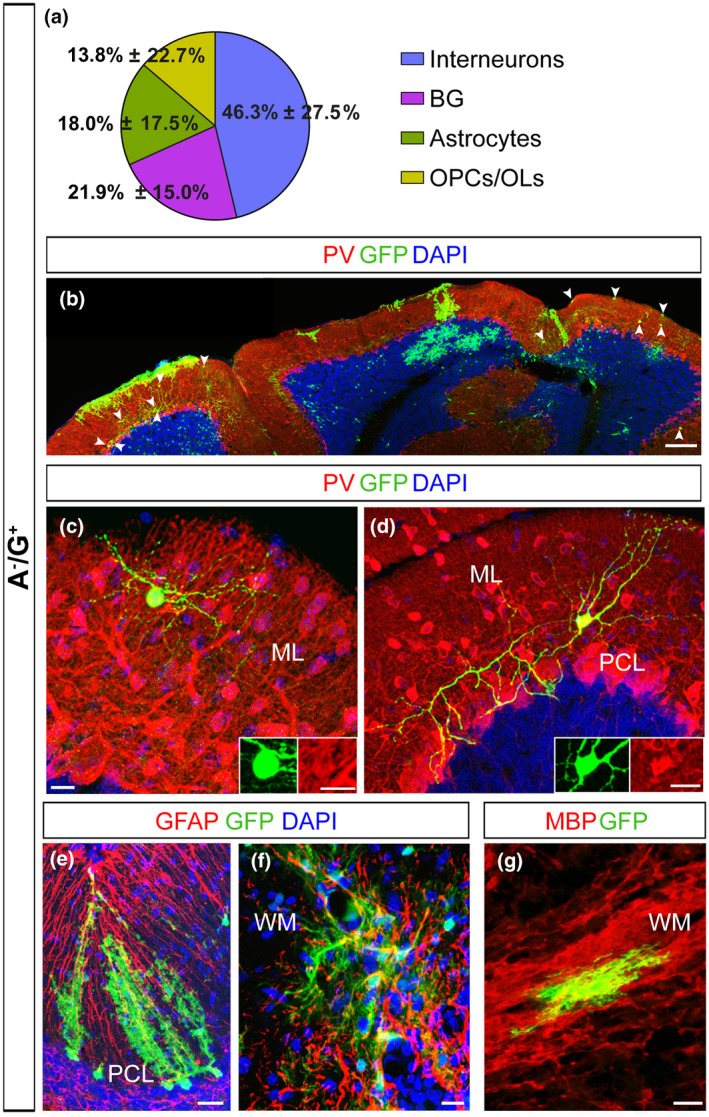
FIGURE 6.

Cell transplantation reveals a multipotent in vivo differentiation potential for A−/G+ precursors. (a–g) A−/G+ cells isolated from β‐actin‐GFP+ cerebella were injected into the cerebellum of β‐actin‐GFP− mice at P1–P3. (a) A pie chart presents the average percentages of GFP+ interneurons, BG, astrocytes and oligodendrocytes among all GFP+ cells in A−/G+ hosts. (b) Low magnification images reveal the presence of interneurons in the ML of A−/G+ grafts (arrowheads in b). (c,d) High magnification pictures (as well as inserts in c and d) illustrate the co‐expression of GFP and PV. (e–g) Transplanted A−/G+ cells give also rise to different glial cells: BG in the PCL (e), parenchymal astrocytes (f) and MBP+ OLs (g) in the WM. Scale bars: 100 μm (b); 20 μm (e–g); 10 μm (c,d). Sample group size: (b,c,e–g (n = 9); d (n = 7)). BG, Bergmann glia; GL, granular cell layer; ML, molecular layer; OPC/OL, oligodendrocyte precursor cells/oligodendrocytes; PCL, Purkinje cell layer; PV, Parvalbumin; WM, white matter
