
FIGURE 1.
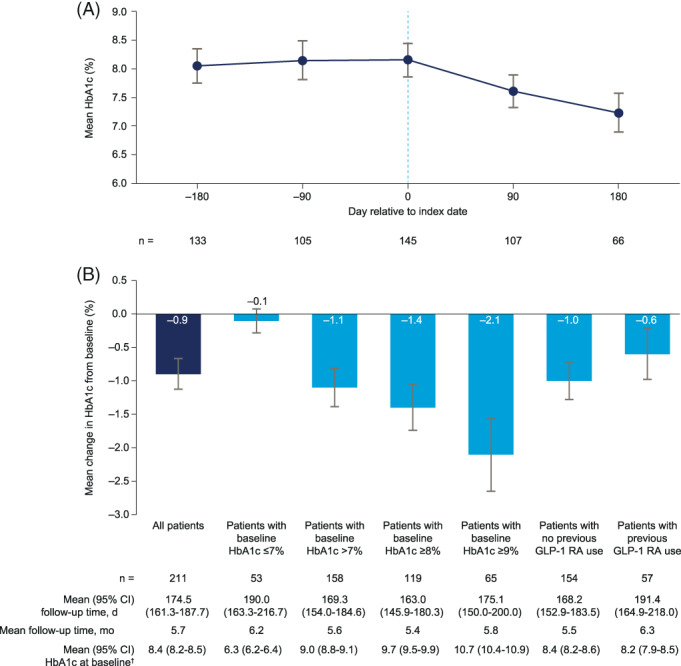
A, HbA1c trajectory and B, HbA1c changes from baseline. The HbA1c trajectory was constructed by extracting HbA1c measurements in five non‐overlapping time periods relative to the index date: day −180 +/−45 days, day −90 +/−45 days, day 0 (index date) −45/+14 days, day 90 +/−45 days and day 180 +/−45 days. For each patient and time period, the measurement closest to the target day was used. Only patients with data for three or more time points were included in the HbA1c trajectory dataset. The dotted line indicates index date. †Mean HbA1c for all patients in the study meeting this criterion. GLP‐1 RA, glucagon‐like peptide‐1 receptor agonist