
FIGURE 5.
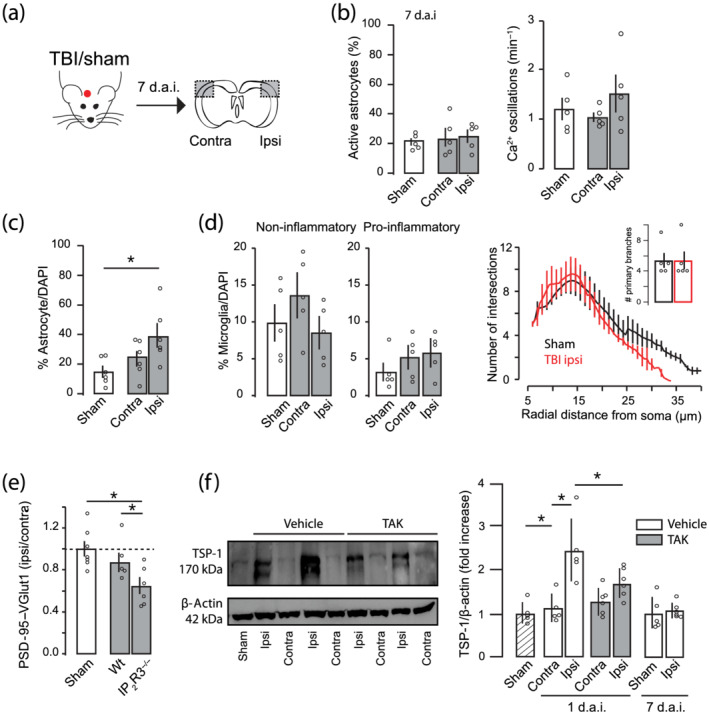
Sub‐acute recovery of astrocyte activity and synaptic density 7 days after traumatic brain injury (TBI). (a) Schematic diagram showing the experimental strategy. (b) Percentage of active astrocytes (left) and number of Ca2+ oscillations (right) in contralateral and ipsilateral cortex of sham (n = 5) or TBI mice (n = 5) 7 days after the injury. (c) Percentage of GFAP+ astrocytes in contralateral and ipsilateral cortex of TBI mice 7 days after injury (n = 6). (d) Quantitative assessment of microglial phenotypes (Iba‐1 staining) in the S1 cortex from sham and TBI mice. Sholl analysis of microglia morphology and primary branches (inset; sham = 5, TBI = 5). (e) Quantitative analysis of synaptic puncta density 7 days after TBI in WT and IP3R2−/− (sham, n = 7; WT, n = 5; IP3R2−/−, n = 6). (f) Left, original (unedited) western blot of TSP‐1 and actin from sham, two vehicles (Veh) and two TAK242 treated mice (TAK). Right, semi‐quantitative analysis of TSP‐1 immunoreactivity of TSP‐1 after TBI (for 24 h mice: sham, n = 5; vehicle, n = 5; TAK242, n = 6; for 7 days after injury (d.a.i.): sham = 5; TBI ipsilateral (ipsi) = 6). Values are mean ± SEM. One‐way ANOVA, Bonferroni's post hoc test, *P < .05