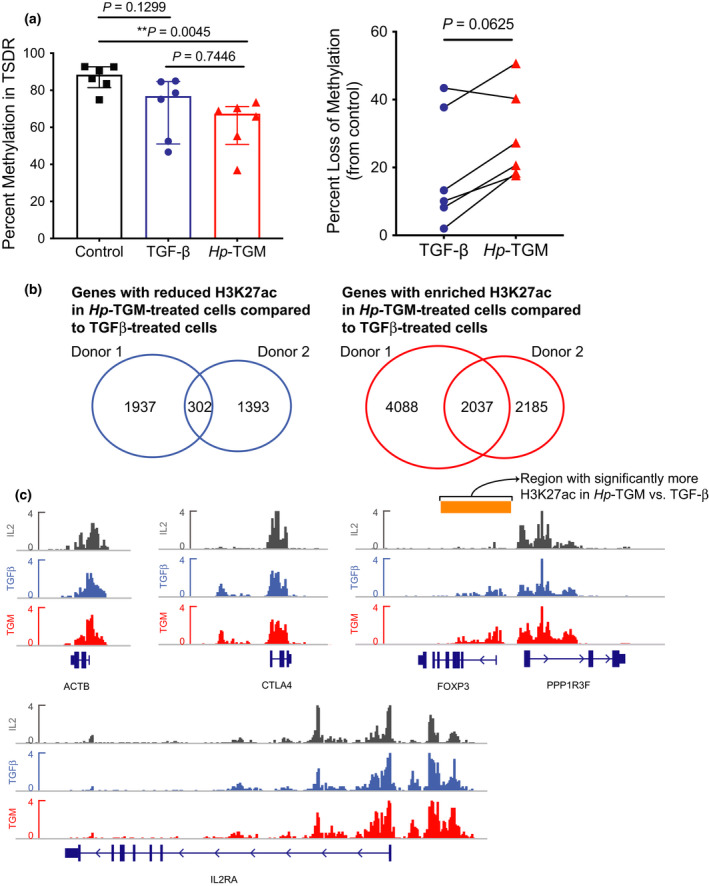
Figure 3.

Hp‐TGM induces epigenetic modification of FOXP3. Naïve CD4+ T cells were expanded with modified L‐cells (as per methods) for 28–32 days with either TGF‐β, or Hp‐TGM (controls had neither added), then viable CD4+ T cells were isolated from cultures by cell sorting. (a) The average percentage methylation is shown for eight CpG sites in the TSDR of FOXP3 for control, TGF‐β and Hp‐TGM‐conditioned cells (n = 6, all males). Data from TGF‐β and Hp‐TGM cultures were converted to a percentage loss of methylation from control. From some cultures, the cells were collected at day 22 in culture, fixed in paraformaldehyde and analyzed by ChIP‐Seq. (b) Genes with reduced (left) and enriched (right) H3K27Ac marks in Hp‐TGM‐treated cells compared with TGF‐β‐treated cells. Shown are Venn diagrams of genes with reduced/enriched H3K27Ac marks comparing n = 2 donors. (c) ChIP‐seq of H3K27Ac tracks at ACTB (β‐actin, control), CTLA4, IL2RA (CD25) and FOXP3 loci. The FOXP3 region identified by Spatial Clustering for Identification of ChIP‐Enriched Regions (SICER) analysis as having significantly more H3K27ac marks compared with TGF‐β is indicated by the orange bar. Analysis in a used Friedman one‐way ANOVA and the Mann‐Whitney U‐test and in b used the Wilcoxon signed rank test. Error bars represent median ± interquartile range.
