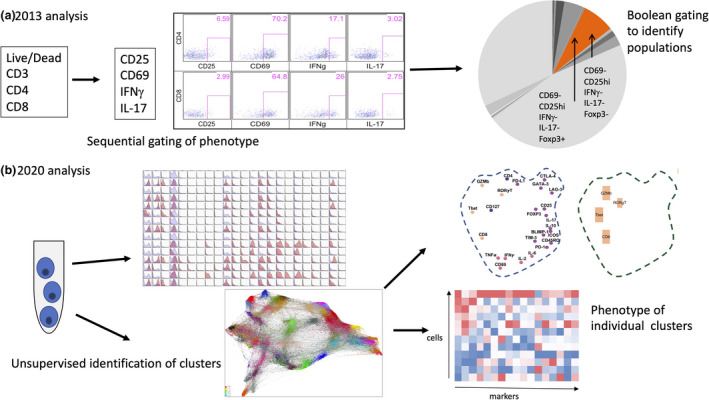
Figure 1.

Comparison of analysis methods for low‐ and high‐dimensional cytometry data sets. (a) A typical analysis pathway with low‐dimensional cytometry performed in 2013. (b) A new analysis pathway with high‐dimensional cytometry, using the same type of samples as in a, performed in 2020. IFN, interferon; IL, interleukin; TNF, tumor necrosis factor.
