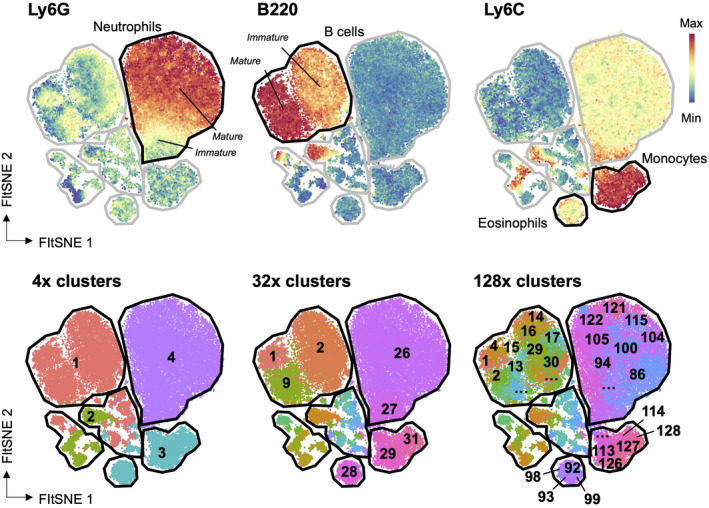
Figure 3.

Overclustering and underclustering. Mouse hematopoietic cells were analyzed by dimensionality reduction and clustering. Expression of individual markers identifying populations is shown in the top row on a dimensionality reduction plot, and in the bottom row clusters are projected onto the same plot. Use of too few clusters (the left panel) fails to identify real populations, whereas too many clusters (the right panel) leads to identification of heterogeneity that is not biologically relevant.
