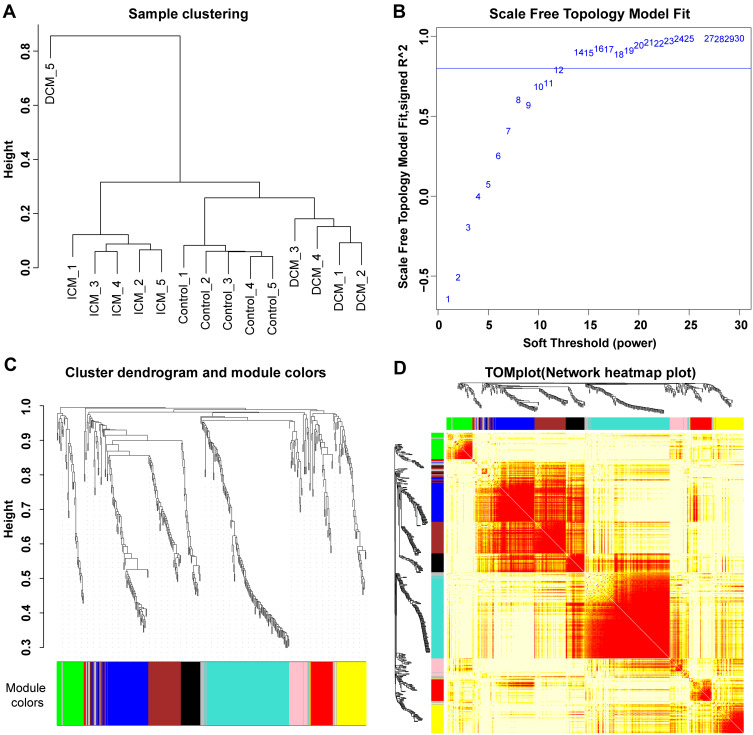
Figure 1.
Sample clustering and modules detected in weighted gene co-expression network analysis. (A) The sample clustering plot. The protein expression data from the DCM_5 sample were discarded in the subsequent analysis due to the heterogeneity of the data from other samples. (B) The scale-free network was constructed with the scale-free R2=0.8, where the soft threshold was set at twelve to get the best-fit topology model. (C) According to the hierarchical clustering dendrogram of proteins, nine modules were detected, namely black, blue, brown, green, grey, pink, red, turquoise, and yellow modules. (D) The topological overlap map (TOM) plot of distinct modules detected. The heatmap showed the topological overlap matrix (TOM) among genes in the analysis. Different colors on the x-axis and y-axis represented different modules. The yellow brightness of the middle part represented the strength of connections between modules.

