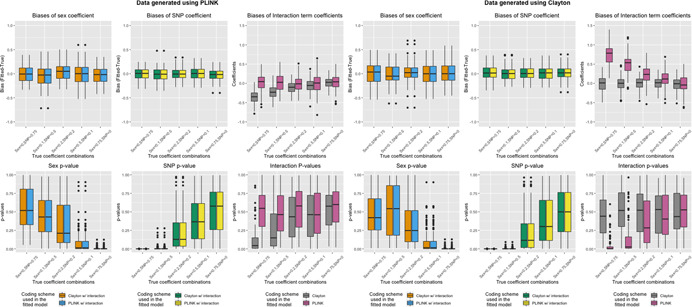
Figure 2.

Bias and p‐values of sex and SNP coefficients when generating data in the absence of sex differences in SNP effect and fitting models with SNP–sex interaction terms. Top row: Boxplots of bias (Y‐axis; estimate minus true coefficient) of sex and SNP coefficients across 1000 simulation runs for various simulation settings (X‐axis) when data is generated using eXCI (PLINK) coding (left) or XCI (Clayton) coding (right). Bottom row: Boxplots of p‐values (Y‐axis) of sex and SNP coefficients across 1000 simulation runs for various simulation settings (X‐axis) when data is generated using eXCI coding (left) or XCI coding (right). Color indicates the model that was fit (Model 3 or Model 4, XCI or eXCI coding with a SNP–sex interaction term)
