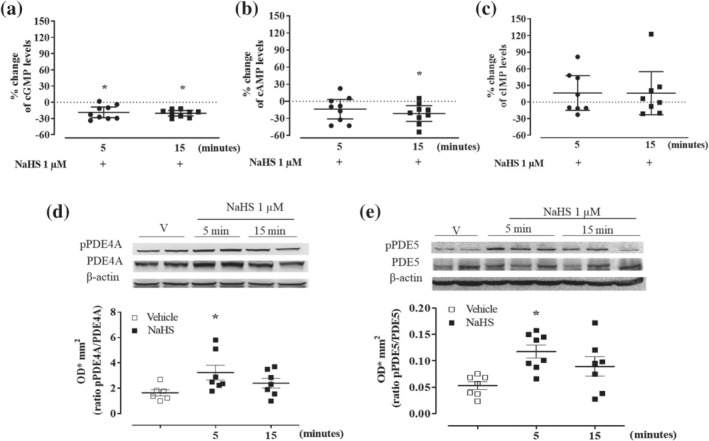
FIGURE 9.

NaHS (1 μM) modulates cyclic nucleotides through PDEs activity in WT mice aorta. Following 5 and 15 min of incubation, NaHS induces (a) significant reduction of cGMP content of 18.7% and 20.3%, compared to the respective vehicle that is 18.58 ± 2.43 pg·mg‐1 tissue (n = 9 determinations), (b) significant reduction of cAMP content of 13.9% and 21.7%, compared to the respective vehicle that is 153.87 ± 6.02 pg·mg‐1 tissue (n = 9 determinations) and (c) trend of increase in inosine 3′,5′‐cyclic monophosphate (cIMP) levels of 16.4% and 15.7%, compared to the respective vehicle that is 5.41 ± 1.05 pg·mg‐1 tissue (n = 8 determinations). Values shown are means ± SEM n = 9 determinations or 8 determinations (three mouse aortas are pulled in each sample) and are expressed as the percentage of change compared to the level measured in the vehicle. *P < 0.05 significantly different; one sample t‐test. (d) Upper: Representative western blot for pPDE4A and PDE4A expression in homogenates of aorta incubated with NaHS (1 μM) for 5 or 15 min or vehicle (V). Lower: Densitometric analysis of pPDE4A/PDE4A ratio. The ratio pPDE4A/PDE4A is significantly enhanced following NaHS incubation at 5 min compared with vehicle (vehicle n = 6 mice; 5 and 15 min n = 7 mice). (e) Upper: Representative western blot for pPDE5 and PDE5 expression in homogenates of aorta incubated with NaHS (1 μM) for 5, 15 min or vehicle. Lower: Densitometric analysis for pPDE5/PDE5 ratio. The ratio pPDE5/PDE5 is significantly enhanced following NaHS incubation at 5 min compared with vehicle (vehicle n = 7 mice; 5 min n = 8 mice; 15 min n = 7 mice). Values shown are means ± SEM and are expressed as optical densitometric (ODmm2). *P < 0.05 significantly different compared to the vehicle; one‐way ANOVA with Bonferroni's post hoc test
