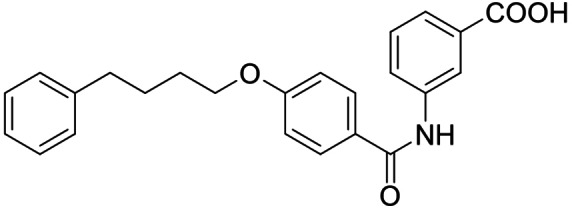
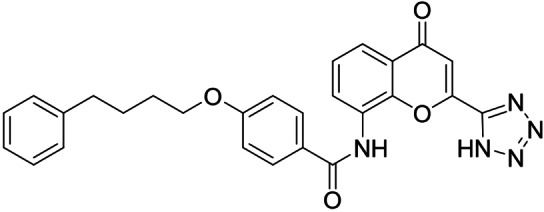
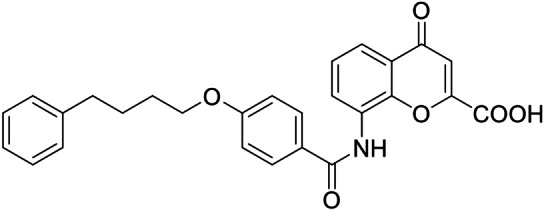
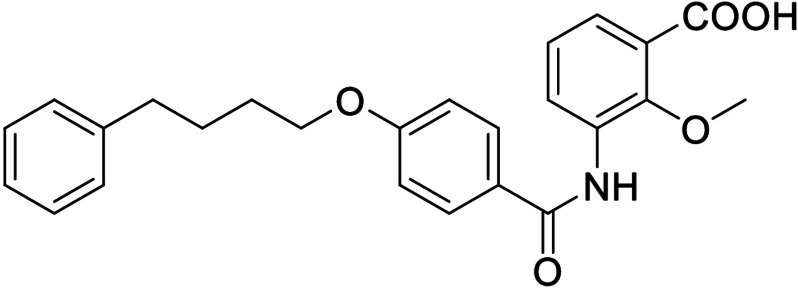
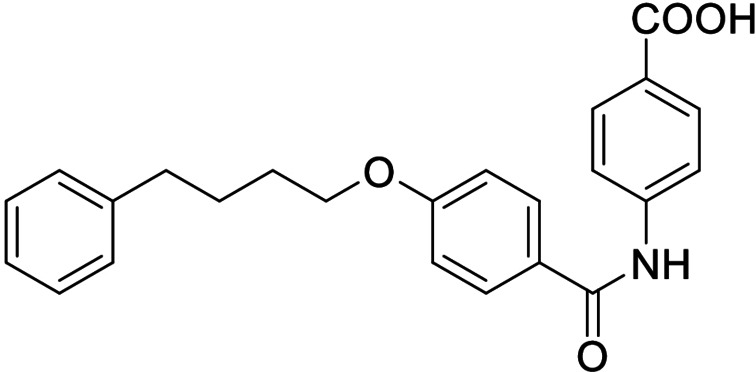
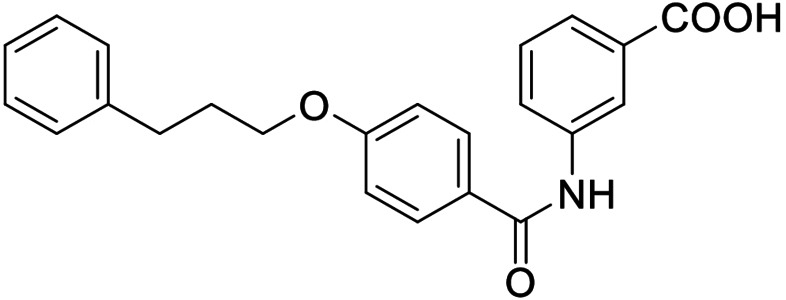
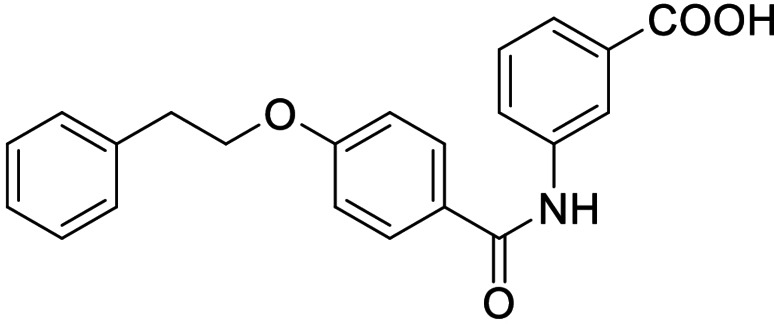
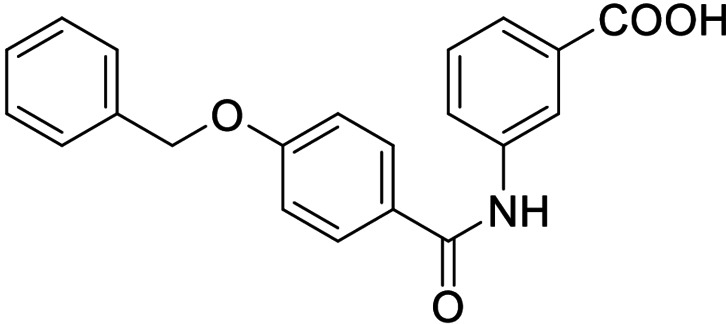
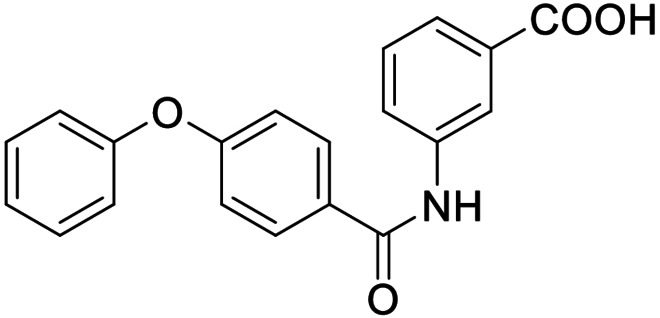
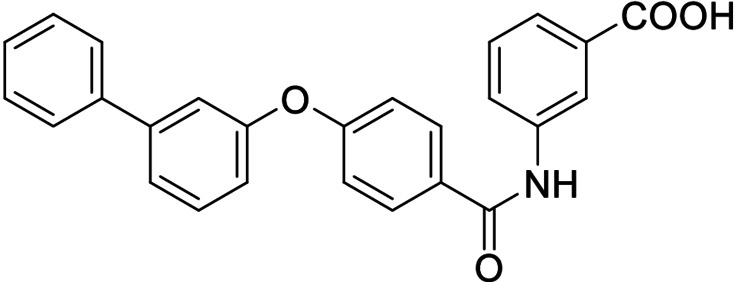
Table 1.
In vitro biological activity of 3–12.
|
ID |
Structure |
EC50(FXR)[a] (efficacy) |
IC50(LTA4H)[b] (max. inhib.) |
|---|---|---|---|
|
3 |
|
0.026±0.001 μM (34±1 %) |
0.54±0.07 μM (97.2±0.4 %) |
|
4 |
|
15±3 μM (27±1 %) |
1.6±0.2 μM (82.6±0.8 %) |
|
5 |
|
inactive (50 μM) |
15±2 μM (80±5 %) |
|
6 |
|
0.19±0.02 μM (26±1 %) |
5.5±0.5 μM (85±2 %) |
|
7 |
|
0.014±0.001 μM (29±1 %) |
0.37±0.02 μM (97.8±0.1 %) |
|
8 |
|
0.029±0.006 μM (22±1 %) |
0.14±0.01 μM (98.8±0.1 %) |
|
9 |
|
0.15±0.02 μM (56±1 %) |
0.61±0.06 μM (96.0±0.2 %) |
|
10 |
|
0.009±0.001 μM (20±1 %) |
1.1±0.1 μM (94.9±0.2 %) |
|
11 |
|
0.0010±0.0003 μM (35±1 %) |
0.55±0.06 μM (98.2±0.1 %) |
|
12 |
|
0.3±0.1 μM (14±1 %) |
5.2±0.6 μM (81.1±0.6 %) |
[a] FXR modulation was determined in a full‐length FXR reporter gene assay based on the human FXR response element from the BSEP promoter. Efficacy refers to maximum FXR activation relative to the activity of 3 μM GW4064 which was defined as 100 % activation. The activity of 3–11 on FXR has been previously reported[25]. Data are the mean±S.E.M., n≥3. [b] LTA4H inhibition was determined on recombinant protein using L‐arginine‐7‐amino‐4‐methylcoumarine as fluorogenic substrate. Maximum inhibition (max. inhib.) refers to LTA4H inhibition at the highest tested concentration. Data are the mean±S.E.M., n=3.

