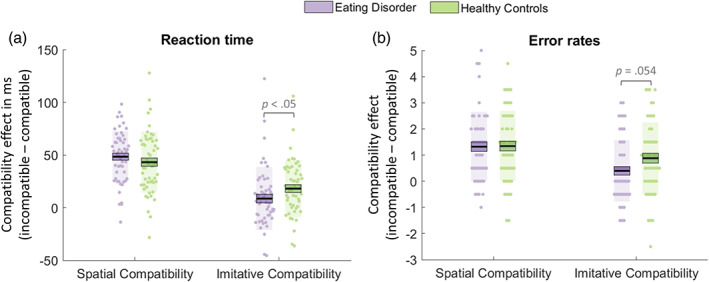
FIGURE 1.

Plots of mean spatial and imitative compatibility effects as measured by reaction times (a) and error rates (b) in participants with an eating disorder (purple) and healthy controls (green). For each condition, data points indicate individual participants. The thick black horizontal line represents the sample mean, the surrounding box represents 1 SEM and the shaded region represents 1 SD [Color figure can be viewed at wileyonlinelibrary.com]
