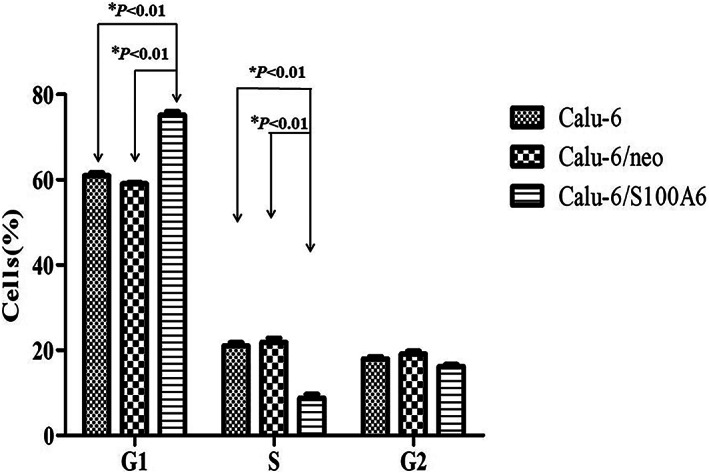
FIGURE 6.

Flow cytometric analysis showed change in cell cycle. The proportions of Calu‐6/S100A6 cells in G1 phase and S phase accounted for (75.16 ± 0.78)% and (8.69 ± 0.84)%, respectively, differing from those in Calu‐6 cells (60.98 ± 0.64, 21.06 ± 0.70) and Calu‐6/neo cells (58.97 ± 0.18, 21.98 ± 1.80)
