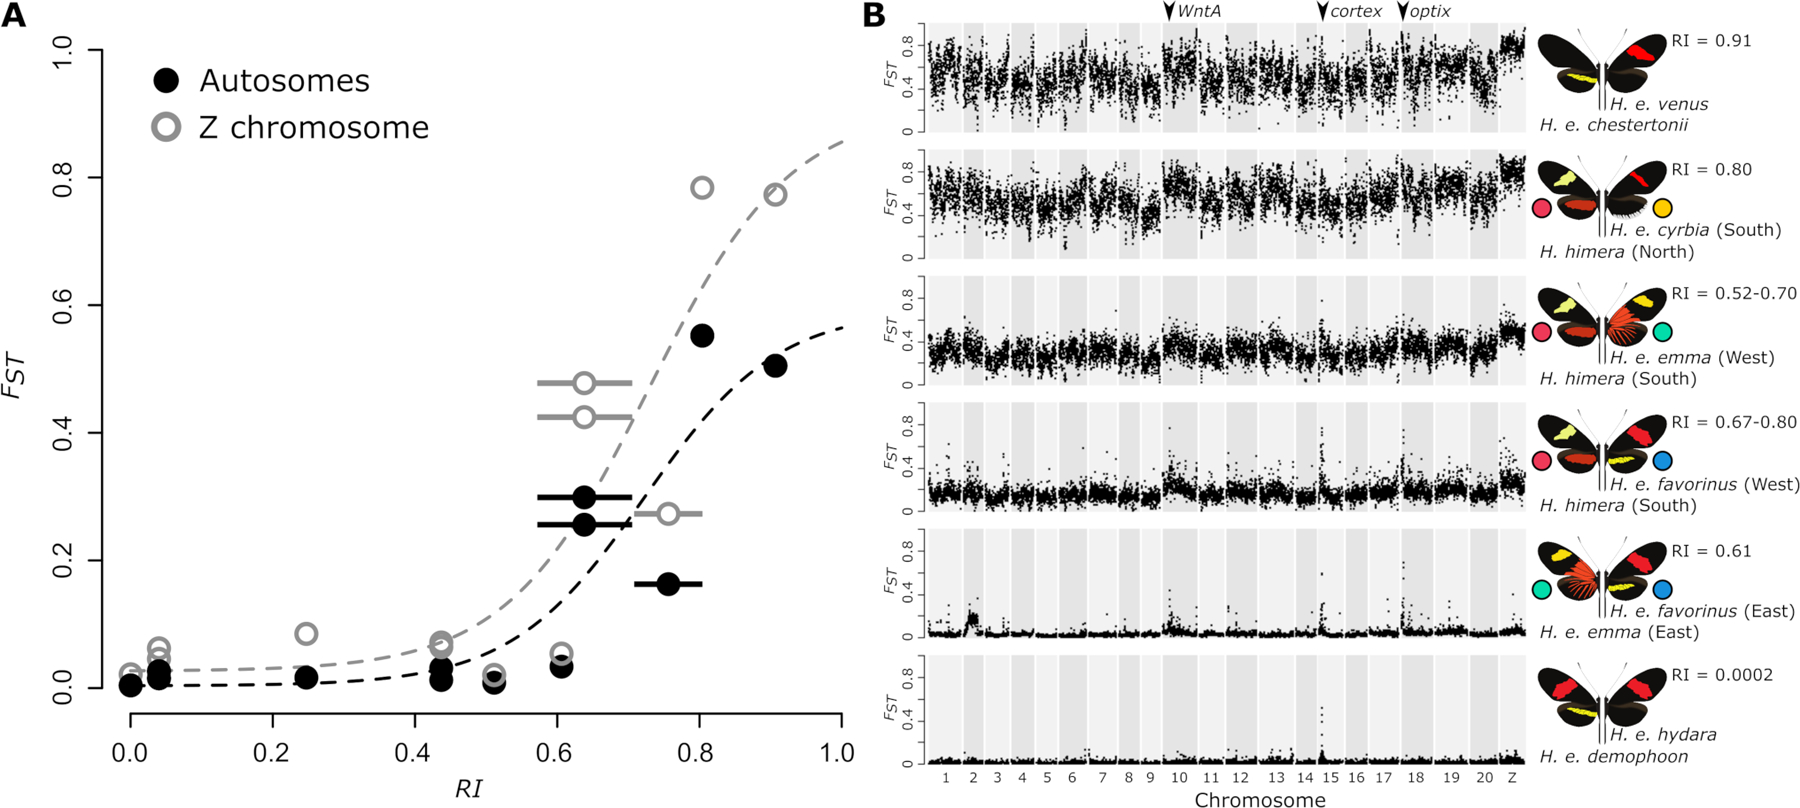
Figure 2. Reproductive isolation and divergence among Heliconius erato populations.

(A) Genome-wide averages of relative divergence (FST) show a sharp increase with increasing measures of reproductive isolation between parapatric H. erato populations. The measure of reproductive isolation (RI) was obtained by weighting ecological (RIec), pre-isolation (RIpre) and post-isolation (RIpost) components using the method of Sobel and Chen (2014) (Table S2). Horizontal bars indicate a range of RI estimates based on uncertainties in RI components. Dashed lines indicate a non-linear least-squares fit for autosome (black) and Z chromosome (gray) relation between FST and RI. Higher relative divergence on the Z chromosome can be observed for the more divergent parapatric comparisons, however, incompatibilities that are potentially Z-linked have only been suggested for H. e. chestertonii crosses (Muñoz et al. 2010; Van Belleghem et al. 2018). (B) Plots of relative divergence (average FST in 50 kb windows) between parapatric H. erato populations along the genome. Plots are ordered according to the measure of reproductive isolation (RI). Colored circles match color codes used for the focal populations in this study. Divergence peaks on chromosome 10, 15 and 18 correspond to the divergently selected color pattern genes WntA (affecting forewing band shape), cortex (affecting yellow hindwing bar), and optix (affecting red color pattern elements), respectively (Van Belleghem et al. 2017).
